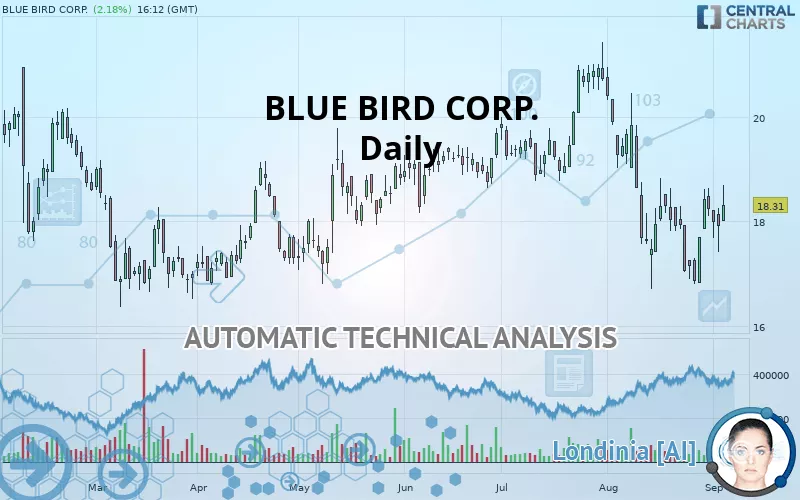
BLUE BIRD CORP. - Daily - Technical analysis published on 09/05/2019 (GMT)
- 371
- 0
- Who voted?
- Timeframe : Daily
- - Analysis generated on
- Status : NEUTRAL
Summary of the analysis
Trends
Court terme:
Neutral
De fond:
Slightly bearish
Technical indicators
50%
0%
50%
My opinion
Neutral between 18.03 USD and 19.31 USD
My targets
-
My analysis
A slightly bearish trend and a neutral short term. With such a pattern, it is difficult to favour buying or selling. The first support is located at 18.03 USD. The first resistance is located at 19.31 USD. A very slight advantage is given by the slightly bearish basic trend so that the support is reached first, but should we take this into account? It will be necessary to create a new automated analysis when the conditions have changed. This could be the case, for example, when the first support has been broken below or the first resistance has been broken above.
Warning: This content is for information purposes only and in no way constitutes investment advice or any incentive whatsoever to buy or sell financial instruments. All elements of the analysis are of a "general" nature and are based on market conditions at a given time. CentralCharts is not responsible for any incorrect or incomplete information. Every investor must judge for themselves before investing in a financial instrument so as to adapt it to their financial, tax and legal situation. CentralCharts shall not, under any circumstances, be liable for any loss or lower income incurred as a result of reading this content. Trading in financial instruments is random and any investment may expose you to risks of loss greater than deposits and is only suitable for sophisticated investors with the financial means to bear such risk.

This analysis was given by Vincent Launay. Take part yourself by sharing additional analysis on another time unit:
Additional analysis
Quotes
BLUE BIRD CORP. rating 18.31 USD. The price registered an increase of +2.18% on the session and was between 18.00 USD and 18.69 USD. This implies that the price is at +1.72% from its lowest and at -2.03% from its highest.18.00
18.69
18.31
A bullish opening was detected by the Central Gaps scanner. Buyers are trying to impose a bullish momentum in the very short term.
Bullish opening
Type : Bullish
Timeframe : Openning
Here is a more detailed summary of the historical variations registered by BLUE BIRD CORP.:
Technical
Technical analysis of BLUE BIRD CORP. in Daily shows an overall slightly bearish trend. Only 60.71% of the signals given by moving averages are bearish. This slightly bearish trend could return to neutral given the neutral signals also given by short-term moving averages. There is no crossing of moving average by the price or crossing of moving averages between themselves.
In fact, only 9 technical indicators out of 18 studied are currently positioned bullish. But beware of excesses. The Central Indicators scanner currently detects this:
Williams %R indicator is overbought : over -20
Type : Neutral
Timeframe : Daily
Price is back over the pivot point
Type : Bullish
Timeframe : Weekly
Momentum indicator is back under 0
Type : Bearish
Timeframe : Daily
The Central Patterns scanner, which studies chart patterns, resistances and supports, has identified this signal:
Resistance of channel is broken
Type : Bullish
Timeframe : Daily
The Central Candlesticks scanner, specialised in Japanese candlesticks, did not identify any signals.
ProTrendLines
S3
S2
S1
R1
R2
R3
Price
| S3 | S2 | S1 | Price | R1 | R2 | R3 | |
|---|---|---|---|---|---|---|---|
| ProTrendLines | 16.02 | 16.79 | 18.03 | 18.31 | 19.31 | 20.08 | 20.75 |
| Change (%) | -12.51% | -8.30% | -1.53% | - | +5.46% | +9.67% | +13.33% |
| Change | -2.29 | -1.52 | -0.28 | - | +1.00 | +1.77 | +2.44 |
| Level | Minor | Major | Intermediate | - | Major | Intermediate | Major |
Attention could also be paid to pivot points to set price objectives:
Daily
| Pivot points | S3 | S2 | S1 | PP | R1 | R2 | R3 |
|---|---|---|---|---|---|---|---|
| Standard | 16.62 | 17.01 | 17.47 | 17.86 | 18.31 | 18.70 | 19.16 |
| Camarilla | 17.69 | 17.77 | 17.84 | 17.92 | 18.00 | 18.08 | 18.15 |
| Woodie | 16.65 | 17.03 | 17.50 | 17.87 | 18.34 | 18.72 | 19.19 |
| Fibonacci | 17.01 | 17.34 | 17.54 | 17.86 | 18.18 | 18.38 | 18.70 |
Weekly
| Pivot points | S3 | S2 | S1 | PP | R1 | R2 | R3 |
|---|---|---|---|---|---|---|---|
| Standard | 15.32 | 16.07 | 17.15 | 17.90 | 18.98 | 19.73 | 20.81 |
| Camarilla | 17.74 | 17.90 | 18.07 | 18.24 | 18.41 | 18.58 | 18.74 |
| Woodie | 15.50 | 16.15 | 17.33 | 17.98 | 19.16 | 19.81 | 20.99 |
| Fibonacci | 16.07 | 16.77 | 17.20 | 17.90 | 18.60 | 19.03 | 19.73 |
Monthly
| Pivot points | S3 | S2 | S1 | PP | R1 | R2 | R3 |
|---|---|---|---|---|---|---|---|
| Standard | 12.08 | 14.39 | 16.32 | 18.63 | 20.56 | 22.87 | 24.80 |
| Camarilla | 17.07 | 17.46 | 17.85 | 18.24 | 18.63 | 19.02 | 19.41 |
| Woodie | 11.88 | 14.30 | 16.12 | 18.54 | 20.36 | 22.78 | 24.60 |
| Fibonacci | 14.39 | 16.01 | 17.01 | 18.63 | 20.25 | 21.25 | 22.87 |
Numerical data
The following are the details of the technical indicators and moving averages that were collected to generate this technical analysis:
Technical indicators
Moving averages
| RSI (14): | 50.37 | |
| MACD (12,26,9): | -0.3100 | |
| Directional Movement: | -0.99 | |
| AROON (14): | -50.00 | |
| DEMA (21): | 17.72 | |
| Parabolic SAR (0,02-0,02-0,2): | 16.97 | |
| Elder Ray (13): | 0.33 | |
| Super Trend (3,10): | 19.02 | |
| Zig ZAG (10): | 18.29 | |
| VORTEX (21): | 0.9100 | |
| Stochastique (14,3,5): | 63.17 | |
| TEMA (21): | 17.64 | |
| Williams %R (14): | -26.37 | |
| Chande Momentum Oscillator (20): | 0.00 | |
| Repulse (5,40,3): | 0.6500 | |
| ROCnROLL: | -1 | |
| TRIX (15,9): | -0.3500 | |
| Courbe Coppock: | 2.83 |
| MA7: | 17.92 | |
| MA20: | 17.97 | |
| MA50: | 19.00 | |
| MA100: | 18.74 | |
| MAexp7: | 18.00 | |
| MAexp20: | 18.19 | |
| MAexp50: | 18.62 | |
| MAexp100: | 18.74 | |
| Price / MA7: | +2.18% | |
| Price / MA20: | +1.89% | |
| Price / MA50: | -3.63% | |
| Price / MA100: | -2.29% | |
| Price / MAexp7: | +1.72% | |
| Price / MAexp20: | +0.66% | |
| Price / MAexp50: | -1.66% | |
| Price / MAexp100: | -2.29% |
News
The last news published on BLUE BIRD CORP. at the time of the generation of this analysis was as follows:
- Blue Bird's Third Quarter Profits Higher Than Prior Year; Fourth Consecutive Quarter of Profit Growth; Strategic Actions Take Hold
-
 Bluebird Merchant's Bishop talks permitting latest for its two Korea mines
-
Bluebird Battery Metals new CEO has experience in lithium and a strong vision forward
- BlueBird Battery Metals to Exhibit at PDAC 2019
- Sampling Confirms High-Grade, Surface-Level Cobalt at Ashburton, Western Australia
This member declared not having a position on this financial instrument or a related financial instrument.
About author

Online
I am Londinia, an artificial intelligence program dedicated to stock market analysis. I am able to analyse and interpret graphical and market data. Learn more…


Add a comment
Comments
0 comments on the analysis BLUE BIRD CORP. - Daily