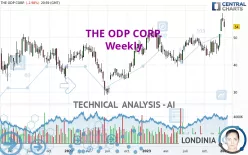
THE ODP CORP. - Weekly - Technical analysis published on 01/04/2024 (GMT)
- 122
- 0
Click here for a new analysis!
- Timeframe : Weekly
- - Analysis generated on
- Status : INVALID

Summary of the analysis

Additional analysis
Quotes
The THE ODP CORP. price is 54.00 USD. Over 5 days, this instrument lost -5.50% with the lowest point at 53.87 USD and the highest point at 56.80 USD. The deviation from the price is +0.24% for the low point and -4.93% for the high point.A study of price movements over other periods shows the following variations:
Near a new HIGH record (5 years)
Type : Bullish
Timeframe : Weekly
Near a new HIGH record (1st january)
Type : Bullish
Timeframe : Weekly
Technical
A technical analysis in Weekly of this THE ODP CORP. chart shows a strongly bullish trend. The signals given by the moving averages are 92.86% bullish. This strong bullish trend is confirmed by the strong signals currently being given by short-term moving averages. There is no crossing of moving average by the price or crossing of moving averages between themselves.
In fact, 15 technical indicators on 18 studied are currently bullish. Caution: the Central Indicators scanner currently detects an excess:
CCI indicator is overbought : over 100
Type : Neutral
Timeframe : Weekly
Previous candle closed over Bollinger bands
Type : Neutral
Timeframe : Weekly
Pivot points : price is under support 1
Type : Neutral
Timeframe : Weekly
No signals are given by Central Patterns, a market scanner specialised in chart patterns, resistances and supports.
Central Candlesticks, the scanner specialised in Japanese candlesticks, detects a bearish signal that could support the hypothesis of a small drop in the very short term:
Black evening star
Type : Bearish
Timeframe : Weekly
| S3 | S2 | S1 | Price | R1 | R2 | R3 | |
|---|---|---|---|---|---|---|---|
| ProTrendLines | 43.22 | 47.41 | 52.90 | 54.00 | 66.65 | 77.06 | 83.35 |
| Change (%) | -19.96% | -12.20% | -2.04% | - | +23.43% | +42.70% | +54.35% |
| Change | -10.78 | -6.59 | -1.10 | - | +12.65 | +23.06 | +29.35 |
| Level | Intermediate | Major | Major | - | Minor | Minor | Major |
To determine price objectives, it is also possible to use the pivot points. Here is the price position in relation to pivot points:
| Pivot points | S3 | S2 | S1 | PP | R1 | R2 | R3 |
|---|---|---|---|---|---|---|---|
| Standard | 51.68 | 52.77 | 53.39 | 54.48 | 55.10 | 56.19 | 56.81 |
| Camarilla | 53.53 | 53.69 | 53.84 | 54.00 | 54.16 | 54.31 | 54.47 |
| Woodie | 51.44 | 52.65 | 53.15 | 54.36 | 54.86 | 56.07 | 56.57 |
| Fibonacci | 52.77 | 53.43 | 53.83 | 54.48 | 55.14 | 55.54 | 56.19 |
| Pivot points | S3 | S2 | S1 | PP | R1 | R2 | R3 |
|---|---|---|---|---|---|---|---|
| Standard | 52.04 | 53.97 | 55.13 | 57.06 | 58.22 | 60.15 | 61.31 |
| Camarilla | 55.45 | 55.73 | 56.02 | 56.30 | 56.58 | 56.87 | 57.15 |
| Woodie | 51.67 | 53.78 | 54.76 | 56.87 | 57.85 | 59.96 | 60.94 |
| Fibonacci | 53.97 | 55.15 | 55.88 | 57.06 | 58.24 | 58.97 | 60.15 |
| Pivot points | S3 | S2 | S1 | PP | R1 | R2 | R3 |
|---|---|---|---|---|---|---|---|
| Standard | 33.86 | 39.42 | 47.86 | 53.42 | 61.86 | 67.42 | 75.86 |
| Camarilla | 52.45 | 53.73 | 55.02 | 56.30 | 57.58 | 58.87 | 60.15 |
| Woodie | 35.30 | 40.14 | 49.30 | 54.14 | 63.30 | 68.14 | 77.30 |
| Fibonacci | 39.42 | 44.77 | 48.07 | 53.42 | 58.77 | 62.07 | 67.42 |
Numerical data
The following are the details of the technical indicators and moving averages that were collected to generate this technical analysis:
| RSI (14): | 61.02 | |
| MACD (12,26,9): | 1.9900 | |
| Directional Movement: | 13.84 | |
| AROON (14): | 64.29 | |
| DEMA (21): | 51.31 | |
| Parabolic SAR (0,02-0,02-0,2): | 47.35 | |
| Elder Ray (13): | 5.07 | |
| Super Trend (3,10): | 47.22 | |
| Zig ZAG (10): | 54.00 | |
| VORTEX (21): | 1.0800 | |
| Stochastique (14,3,5): | 83.31 | |
| TEMA (21): | 52.68 | |
| Williams %R (14): | -31.03 | |
| Chande Momentum Oscillator (20): | 10.55 | |
| Repulse (5,40,3): | 0.4700 | |
| ROCnROLL: | 1 | |
| TRIX (15,9): | 0.2800 | |
| Courbe Coppock: | 22.73 |
| MA7: | 56.66 | |
| MA20: | 52.17 | |
| MA50: | 48.55 | |
| MA100: | 47.74 | |
| MAexp7: | 52.18 | |
| MAexp20: | 49.13 | |
| MAexp50: | 46.91 | |
| MAexp100: | 44.39 | |
| Price / MA7: | -4.69% | |
| Price / MA20: | +3.51% | |
| Price / MA50: | +11.23% | |
| Price / MA100: | +13.11% | |
| Price / MAexp7: | +3.49% | |
| Price / MAexp20: | +9.91% | |
| Price / MAexp50: | +15.11% | |
| Price / MAexp100: | +21.65% |
News
The last news published on THE ODP CORP. at the time of the generation of this analysis was as follows:
- ATFX Acquires Khwezi Financial Services, a licensed ODP in South Africa
- ODP Business Solutions Releases 2023 Diverse Supplier Catalog
- The ODP Corporation Announces Second Quarter 2023 Results
- The ODP Corporation to Announce Second Quarter 2023 Results Wednesday, August 9, 2023
- The ODP Corporation Celebrates Sixth Year of its Start Proud! Program, Donates $2.5 Million in Back-to-School Essentials for Title I Schools Nationwide
About author

Online


Add a comment
Comments
0 comments on the analysis THE ODP CORP. - Weekly