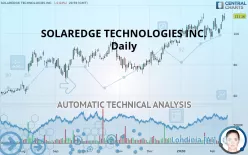
SOLAREDGE TECHNOLOGIES INC. - Daily - Technical analysis published on 02/14/2020 (GMT)
- 400
- 0
- Who voted?
Click here for a new analysis!
- Timeframe : Daily
- - Analysis generated on
- Status : TARGET REACHED

Summary of the analysis

Additional analysis
Quotes
The SOLAREDGE TECHNOLOGIES INC. price is 111.16 USD. On the day, this instrument gained -0.63% and was between 108.69 USD and 113.20 USD. This implies that the price is at +2.27% from its lowest and at -1.80% from its highest.The Central Gaps scanner detects a bearish opening marking the presence of sellers ahead of buyers at the opening but not sufficiently marked to allow the price to register a quotation gap.
Bearish opening
Type : Bearish
Timeframe : Openning
A study of price movements over other periods shows the following variations:
New HIGH record (5 years)
Type : Bullish
Timeframe : Weekly
New HIGH record (1 year)
Type : Bullish
Timeframe : Weekly
New HIGH record (1st january)
Type : Bullish
Timeframe : Weekly
New HIGH record (1 month)
Type : Bullish
Timeframe : Weekly
Technical
Technical analysis of SOLAREDGE TECHNOLOGIES INC. in Daily shows a strongly overall bullish trend. The signals given by the moving averages are 92.86% bullish. This strong bullish trend is confirmed by the strong signals currently being given by short-term moving averages. The Central Indicators scanner does not detect any result on moving averages that would impact this trend.
In fact, 14 technical indicators on 18 studied are currently positioned bullish. But beware of excesses. The Central Indicators scanner currently detects this:
CCI indicator is overbought : over 100
Type : Neutral
Timeframe : Daily
Williams %R indicator is overbought : over -20
Type : Neutral
Timeframe : Daily
Pivot points : price is over resistance 1
Type : Neutral
Timeframe : Weekly
MACD crosses UP its Moving Average
Type : Bullish
Timeframe : Daily
Parabolic SAR indicator bullish reversal
Type : Bullish
Timeframe : Daily
Price is back over the pivot point
Type : Bullish
Timeframe : Daily
Momentum indicator is back over 0
Type : Bullish
Timeframe : Daily
An analysis of the price chart with the Central Patterns scanner (detector of chart patterns and resistances and supports) shows a result that can have an impact on the price change:
Resistance of triangle is broken
Type : Bullish
Timeframe : Daily
The presence of a bullish Japanese candlestick pattern detected by Central Candlesticks that could cause a very short term rebound was also detected:
Upside gap
Type : Bullish
Timeframe : Daily
| S3 | S2 | S1 | Price | |
|---|---|---|---|---|
| ProTrendLines | 76.42 | 93.50 | 110.13 | 111.16 |
| Change (%) | -31.25% | -15.89% | -0.93% | - |
| Change | -34.74 | -17.66 | -1.03 | - |
| Level | Minor | Major | Intermediate | - |
To determine price objectives, it is also possible to use the pivot points. Here is the price position in relation to pivot points:
| Pivot points | S3 | S2 | S1 | PP | R1 | R2 | R3 |
|---|---|---|---|---|---|---|---|
| Standard | 103.91 | 105.66 | 108.76 | 110.52 | 113.62 | 115.37 | 118.47 |
| Camarilla | 110.53 | 110.97 | 111.42 | 111.86 | 112.31 | 112.75 | 113.20 |
| Woodie | 104.58 | 106.00 | 109.43 | 110.85 | 114.29 | 115.71 | 119.14 |
| Fibonacci | 105.66 | 107.52 | 108.66 | 110.52 | 112.37 | 113.52 | 115.37 |
| Pivot points | S3 | S2 | S1 | PP | R1 | R2 | R3 |
|---|---|---|---|---|---|---|---|
| Standard | 83.31 | 90.49 | 95.55 | 102.73 | 107.79 | 114.97 | 120.03 |
| Camarilla | 97.25 | 98.38 | 99.50 | 100.62 | 101.74 | 102.86 | 103.99 |
| Woodie | 82.26 | 89.96 | 94.50 | 102.20 | 106.74 | 114.44 | 118.98 |
| Fibonacci | 90.49 | 95.16 | 98.05 | 102.73 | 107.40 | 110.29 | 114.97 |
| Pivot points | S3 | S2 | S1 | PP | R1 | R2 | R3 |
|---|---|---|---|---|---|---|---|
| Standard | 74.59 | 85.29 | 91.58 | 102.28 | 108.57 | 119.27 | 125.56 |
| Camarilla | 93.19 | 94.75 | 96.30 | 97.86 | 99.42 | 100.98 | 102.53 |
| Woodie | 72.38 | 84.19 | 89.37 | 101.18 | 106.36 | 118.17 | 123.35 |
| Fibonacci | 85.29 | 91.78 | 95.79 | 102.28 | 108.77 | 112.78 | 119.27 |
Numerical data
The following is the status of technical indicators and moving averages registered at the time this technical analysis was created:
| RSI (14): | 60.60 | |
| MACD (12,26,9): | 2.4200 | |
| Directional Movement: | 11.72 | |
| AROON (14): | 92.86 | |
| DEMA (21): | 107.67 | |
| Parabolic SAR (0,02-0,02-0,2): | 96.33 | |
| Elder Ray (13): | 5.38 | |
| Super Trend (3,10): | 114.28 | |
| Zig ZAG (10): | 111.16 | |
| VORTEX (21): | 1.0500 | |
| Stochastique (14,3,5): | 80.17 | |
| TEMA (21): | 107.24 | |
| Williams %R (14): | -11.86 | |
| Chande Momentum Oscillator (20): | 7.80 | |
| Repulse (5,40,3): | 5.7200 | |
| ROCnROLL: | 1 | |
| TRIX (15,9): | 0.3000 | |
| Courbe Coppock: | 1.53 |
| MA7: | 105.81 | |
| MA20: | 104.76 | |
| MA50: | 98.46 | |
| MA100: | 91.12 | |
| MAexp7: | 107.07 | |
| MAexp20: | 104.39 | |
| MAexp50: | 99.10 | |
| MAexp100: | 91.88 | |
| Price / MA7: | +5.06% | |
| Price / MA20: | +6.11% | |
| Price / MA50: | +12.90% | |
| Price / MA100: | +21.99% | |
| Price / MAexp7: | +3.82% | |
| Price / MAexp20: | +6.49% | |
| Price / MAexp50: | +12.17% | |
| Price / MAexp100: | +20.98% |
News
Don"t forget to follow the news on SOLAREDGE TECHNOLOGIES INC.. At the time of publication of this analysis, the latest news was as follows:
- SolarEdge to Announce Financial Results for the Third Quarter 2019 on Wednesday, November 6, 2019
- SolarEdge Files Three Patent Infringement Lawsuits Against Huawei in China
- SolarEdge Unveiling Enhanced Commercial Offering and Residential StorEdge at SPI
- SolarEdge Announces Fourth Quarter and Full Year 2018 Financial Results
- SolarEdge to Announce Financial Results for the Fourth Quarter and Year Ended December 31, 2018 on Wednesday, February 20, 2019
About author

Online


Add a comment
Comments
0 comments on the analysis SOLAREDGE TECHNOLOGIES INC. - Daily