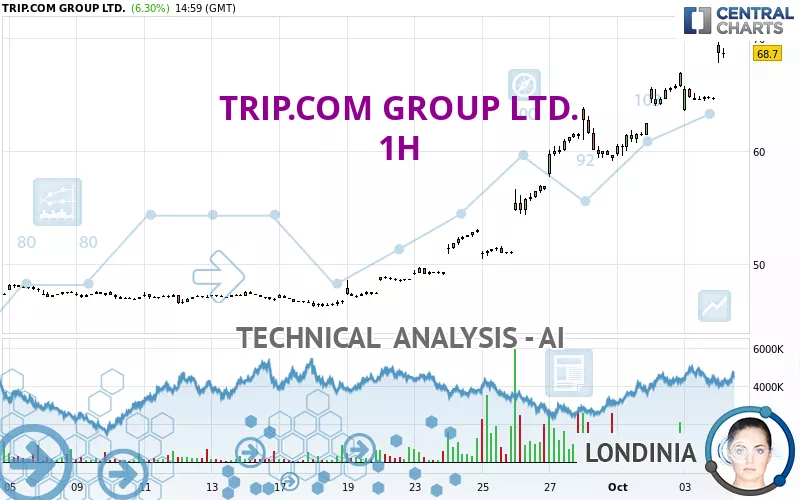
TRIP.COM GROUP LTD. - 1H - Technical analysis published on 10/04/2024 (GMT)
- 168
- 0
Click here for a new analysis!
- Timeframe : 1H
- - Analysis generated on
- Status : INVALID

Summary of the analysis

Additional analysis
Quotes
The TRIP.COM GROUP LTD. rating is 68.70 USD. On the day, this instrument gained +6.30% with the lowest point at 67.81 USD and the highest point at 69.67 USD. The deviation from the price is +1.31% for the low point and -1.39% for the high point.The Central Gaps scanner detects a bullish gap which is a sign that buyers have taken the lead in the very short term.
Opening Gap UP
Type : Bullish
Timeframe : Openning
Here is a more detailed summary of the historical variations registered by TRIP.COM GROUP LTD.:
New HIGH record (5 years)
Type : Bullish
Timeframe : Weekly
New HIGH record (1 year)
Type : Bullish
Timeframe : Weekly
New HIGH record (1st january)
Type : Bullish
Timeframe : Weekly
New HIGH record (1 month)
Type : Bullish
Timeframe : Weekly
The Central Volumes scanner notes the presence of abnormal volumes:
Abnormal volumes
Timeframe : 5 days
Technical
A technical analysis in 1H of this TRIP.COM GROUP LTD. chart shows a strongly bullish trend. The signals given by the moving averages are 92.86% bullish. This strong bullish trend is confirmed by the strong signals currently being given by short-term moving averages. The Central Indicators market scanner currently does not detect any result that concerns moving averages.
The probability of a further increase is high given the direction of the technical indicators.
Caution: the Central Indicators scanner currently detects an excess:
RSI indicator is overbought : over 70
Type : Neutral
Timeframe : 1 hour
CCI indicator is overbought : over 100
Type : Neutral
Timeframe : 1 hour
Williams %R indicator is overbought : over -20
Type : Neutral
Timeframe : 1 hour
Pivot points : price is over resistance 1
Type : Neutral
Timeframe : Weekly
Pivot points : price is over resistance 3
Type : Neutral
Timeframe : 1 hour
MACD crosses UP its Moving Average
Type : Bullish
Timeframe : 1 hour
Central Patterns, the market scanner focusing on chart patterns, resistances and supports found this result:
Resistance of channel is broken
Type : Bullish
Timeframe : 1 hour
The presence of a bullish Japanese candlestick pattern detected by Central Candlesticks that could cause a very short term rebound was also detected:
Bullish harami
Type : Bullish
Timeframe : 1 hour
| S3 | S2 | S1 | Price | |
|---|---|---|---|---|
| ProTrendLines | 59.73 | 63.77 | 67.02 | 68.70 |
| Change (%) | -13.06% | -7.18% | -2.45% | - |
| Change | -8.97 | -4.93 | -1.68 | - |
| Level | Major | Minor | Intermediate | - |
To determine price objectives, it is also possible to use the pivot points. Here is the price position in relation to pivot points:
| Pivot points | S3 | S2 | S1 | PP | R1 | R2 | R3 |
|---|---|---|---|---|---|---|---|
| Standard | 61.41 | 62.50 | 63.56 | 64.65 | 65.71 | 66.80 | 67.86 |
| Camarilla | 64.04 | 64.24 | 64.43 | 64.63 | 64.83 | 65.02 | 65.22 |
| Woodie | 61.41 | 62.49 | 63.56 | 64.64 | 65.71 | 66.79 | 67.86 |
| Fibonacci | 62.50 | 63.32 | 63.83 | 64.65 | 65.47 | 65.98 | 66.80 |
| Pivot points | S3 | S2 | S1 | PP | R1 | R2 | R3 |
|---|---|---|---|---|---|---|---|
| Standard | 40.36 | 44.69 | 53.00 | 57.33 | 65.64 | 69.97 | 78.28 |
| Camarilla | 57.84 | 59.00 | 60.16 | 61.32 | 62.48 | 63.64 | 64.80 |
| Woodie | 42.36 | 45.69 | 55.00 | 58.33 | 67.64 | 70.97 | 80.28 |
| Fibonacci | 44.69 | 49.52 | 52.50 | 57.33 | 62.16 | 65.14 | 69.97 |
| Pivot points | S3 | S2 | S1 | PP | R1 | R2 | R3 |
|---|---|---|---|---|---|---|---|
| Standard | 31.46 | 38.83 | 49.13 | 56.50 | 66.80 | 74.17 | 84.47 |
| Camarilla | 54.57 | 56.19 | 57.81 | 59.43 | 61.05 | 62.67 | 64.29 |
| Woodie | 32.93 | 39.56 | 50.60 | 57.23 | 68.27 | 74.90 | 85.94 |
| Fibonacci | 38.83 | 45.58 | 49.75 | 56.50 | 63.25 | 67.42 | 74.17 |
Numerical data
The following is the status of technical indicators and moving averages registered at the time this technical analysis was created:
| RSI (14): | 77.17 | |
| MACD (12,26,9): | 1.8900 | |
| Directional Movement: | 36.81 | |
| AROON (14): | 50.00 | |
| DEMA (21): | 67.26 | |
| Parabolic SAR (0,02-0,02-0,2): | 64.50 | |
| Elder Ray (13): | 3.14 | |
| Super Trend (3,10): | 65.00 | |
| Zig ZAG (10): | 68.94 | |
| VORTEX (21): | 1.1100 | |
| Stochastique (14,3,5): | 67.32 | |
| TEMA (21): | 67.21 | |
| Williams %R (14): | -11.74 | |
| Chande Momentum Oscillator (20): | 3.57 | |
| Repulse (5,40,3): | 0.3300 | |
| ROCnROLL: | 1 | |
| TRIX (15,9): | 0.4200 | |
| Courbe Coppock: | 9.29 |
| MA7: | 62.93 | |
| MA20: | 53.30 | |
| MA50: | 47.31 | |
| MA100: | 48.78 | |
| MAexp7: | 66.57 | |
| MAexp20: | 64.71 | |
| MAexp50: | 60.91 | |
| MAexp100: | 56.61 | |
| Price / MA7: | +9.17% | |
| Price / MA20: | +28.89% | |
| Price / MA50: | +45.21% | |
| Price / MA100: | +40.84% | |
| Price / MAexp7: | +3.20% | |
| Price / MAexp20: | +6.17% | |
| Price / MAexp50: | +12.79% | |
| Price / MAexp100: | +21.36% |
About author
Online


Add a comment
Comments
0 comments on the analysis TRIP.COM GROUP LTD. - 1H