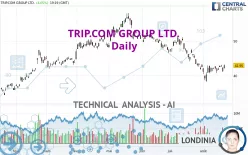
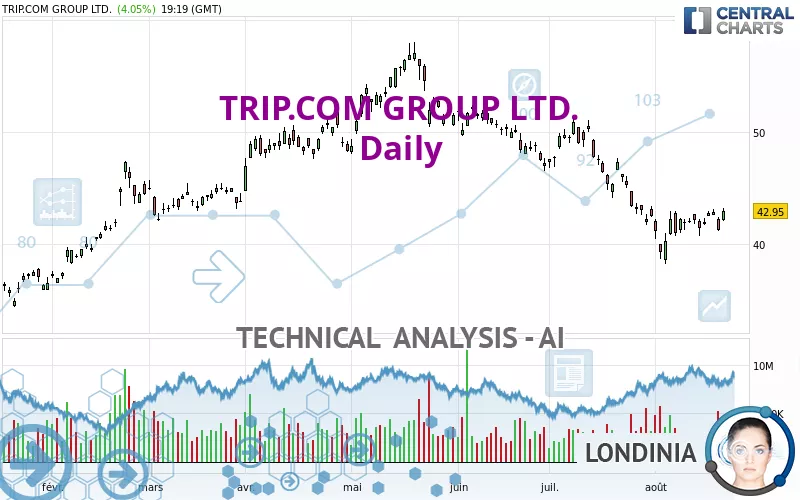
TRIP.COM GROUP LTD. - Daily - Technical analysis published on 08/21/2024 (GMT)
- 159
- 0
Click here for a new analysis!
- Timeframe : Daily
- - Analysis generated on
- Status : INVALID
Summary of the analysis

Additional analysis
Quotes
TRIP.COM GROUP LTD. rating 42.95 USD. The price has increased by +4.05% since the last closing and was traded between 42.06 USD and 43.24 USD over the period. The price is currently at +2.12% from its lowest and -0.67% from its highest.A bullish opening was detected by the Central Gaps scanner. Buyers are trying to impose a bullish momentum in the very short term.
Bullish opening
Type : Bullish
Timeframe : Openning
Here is a more detailed summary of the historical variations registered by TRIP.COM GROUP LTD.:
Technical
Technical analysis of this Daily chart of TRIP.COM GROUP LTD. indicates that the overall trend is bearish. The signals given by moving averages are 75.00% bearish. This bearish trend could slow down given the neutral signals currently being given by short-term moving averages. The Central Indicators scanner detects a bullish signal on moving averages that could impact this trend:
Bullish price crossover with Moving Average 20
Type : Bullish
Timeframe : Daily
The technical indicators are bullish. There is still some doubt about the price increase.
Caution: the Central Indicators scanner currently detects an excess:
Williams %R indicator is overbought : over -20
Type : Neutral
Timeframe : Daily
Pivot points : price is over resistance 2
Type : Neutral
Timeframe : Daily
Aroon indicator bullish trend
Type : Bullish
Timeframe : Daily
An analysis of the price chart with the Central Patterns scanner (detector of chart patterns and resistances and supports) shows several results that can have an impact on the price change:
Near resistance of channel
Type : Bearish
Timeframe : Daily
Horizontal resistance is broken
Type : Bullish
Timeframe : Daily
The Central Candlesticks scanner which studies Japanese candlesticks did not detect anything.
| S3 | S2 | S1 | Price | R1 | R2 | R3 | |
|---|---|---|---|---|---|---|---|
| ProTrendLines | 34.98 | 40.18 | 42.27 | 42.95 | 44.57 | 47.34 | 51.72 |
| Change (%) | -18.56% | -6.45% | -1.58% | - | +3.77% | +10.22% | +20.42% |
| Change | -7.97 | -2.77 | -0.68 | - | +1.62 | +4.39 | +8.77 |
| Level | Major | Major | Intermediate | - | Major | Intermediate | Major |
Attention could also be paid to pivot points to set price objectives:
| Pivot points | S3 | S2 | S1 | PP | R1 | R2 | R3 |
|---|---|---|---|---|---|---|---|
| Standard | 39.67 | 40.45 | 40.86 | 41.64 | 42.05 | 42.83 | 43.24 |
| Camarilla | 40.95 | 41.06 | 41.17 | 41.28 | 41.39 | 41.50 | 41.61 |
| Woodie | 39.50 | 40.36 | 40.69 | 41.55 | 41.88 | 42.74 | 43.07 |
| Fibonacci | 40.45 | 40.90 | 41.18 | 41.64 | 42.09 | 42.37 | 42.83 |
| Pivot points | S3 | S2 | S1 | PP | R1 | R2 | R3 |
|---|---|---|---|---|---|---|---|
| Standard | 39.02 | 39.86 | 41.31 | 42.15 | 43.60 | 44.44 | 45.89 |
| Camarilla | 42.12 | 42.33 | 42.54 | 42.75 | 42.96 | 43.17 | 43.38 |
| Woodie | 39.32 | 40.01 | 41.61 | 42.30 | 43.90 | 44.59 | 46.19 |
| Fibonacci | 39.86 | 40.74 | 41.28 | 42.15 | 43.03 | 43.57 | 44.44 |
| Pivot points | S3 | S2 | S1 | PP | R1 | R2 | R3 |
|---|---|---|---|---|---|---|---|
| Standard | 29.25 | 35.47 | 39.00 | 45.22 | 48.75 | 54.97 | 58.50 |
| Camarilla | 39.85 | 40.74 | 41.64 | 42.53 | 43.42 | 44.32 | 45.21 |
| Woodie | 27.91 | 34.80 | 37.66 | 44.55 | 47.41 | 54.30 | 57.16 |
| Fibonacci | 35.47 | 39.20 | 41.50 | 45.22 | 48.95 | 51.25 | 54.97 |
Numerical data
The following are the details of the technical indicators and moving averages that were collected to generate this technical analysis:
| RSI (14): | 48.22 | |
| MACD (12,26,9): | -1.0500 | |
| Directional Movement: | -8.17 | |
| AROON (14): | 85.71 | |
| DEMA (21): | 41.20 | |
| Parabolic SAR (0,02-0,02-0,2): | 39.98 | |
| Elder Ray (13): | 0.31 | |
| Super Trend (3,10): | 44.15 | |
| Zig ZAG (10): | 43.03 | |
| VORTEX (21): | 0.7800 | |
| Stochastique (14,3,5): | 82.58 | |
| TEMA (21): | 41.57 | |
| Williams %R (14): | -4.39 | |
| Chande Momentum Oscillator (20): | 2.71 | |
| Repulse (5,40,3): | 0.4200 | |
| ROCnROLL: | -1 | |
| TRIX (15,9): | -0.4800 | |
| Courbe Coppock: | 0.02 |
| MA7: | 42.22 | |
| MA20: | 42.00 | |
| MA50: | 45.94 | |
| MA100: | 48.62 | |
| MAexp7: | 42.28 | |
| MAexp20: | 42.82 | |
| MAexp50: | 45.10 | |
| MAexp100: | 45.88 | |
| Price / MA7: | +1.73% | |
| Price / MA20: | +2.26% | |
| Price / MA50: | -6.51% | |
| Price / MA100: | -11.66% | |
| Price / MAexp7: | +1.58% | |
| Price / MAexp20: | +0.30% | |
| Price / MAexp50: | -4.77% | |
| Price / MAexp100: | -6.39% |
About author
Online


Add a comment
Comments
0 comments on the analysis TRIP.COM GROUP LTD. - Daily