TRIP.COM GROUP LTD. - 1H - Technical analysis published on 05/03/2024 (GMT)
- 156
- 0
Click here for a new analysis!
- Timeframe : 1H
- - Analysis generated on
- Status : LEVEL MAINTAINED
Summary of the analysis

Additional analysis
Quotes
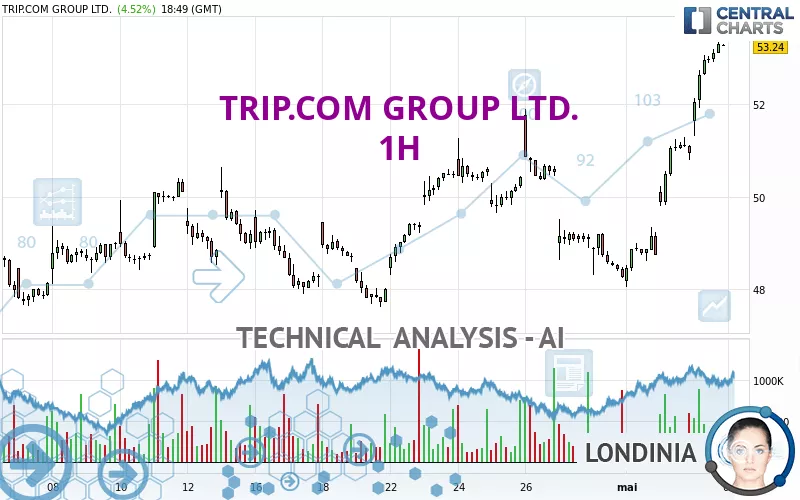
TRIP.COM GROUP LTD. rating 53.31 USD. The price has increased by +4.65% since the last closing and was between 51.30 USD and 53.33 USD. This implies that the price is at +3.92% from its lowest and at -0.04% from its highest.The Central Gaps scanner detects the formation of a bullish gap marking the strong presence of buyers against sellers at the opening. This formed a quotation gap.
Opening Gap UP
Type : Bullish
Timeframe : Openning
So that you have an overall view of the price change, here is a table showing the variations over several periods:
New HIGH record (5 years)
Type : Bullish
Timeframe : Weekly
New HIGH record (1 year)
Type : Bullish
Timeframe : Weekly
New HIGH record (1st january)
Type : Bullish
Timeframe : Weekly
New HIGH record (1 month)
Type : Bullish
Timeframe : Weekly
Technical
A technical analysis in 1H of this TRIP.COM GROUP LTD. chart shows a strongly bullish trend. 92.86% of the signals given by moving averages are bullish. This strongly bullish trend is supported by the strong bullish signals given by short-term moving averages. The Central Indicators market scanner currently does not detect any result that concerns moving averages.
The probability of a further increase is high given the direction of the technical indicators.
Caution: the Central Indicators scanner currently detects an excess:
RSI indicator is overbought : over 80
Type : Neutral
Timeframe : 1 hour
CCI indicator is overbought : over 100
Type : Neutral
Timeframe : 1 hour
Williams %R indicator is overbought : over -20
Type : Neutral
Timeframe : 1 hour
Pivot points : price is over resistance 1
Type : Neutral
Timeframe : Weekly
Pivot points : price is over resistance 3
Type : Neutral
Timeframe : 1 hour
The Central Patterns scanner, which studies chart patterns, resistances and supports, has identified this signal:
Resistance of channel is broken
Type : Bullish
Timeframe : 1 hour
The Central Candlesticks scanner, specialised in Japanese candlesticks, did not identify any signals.
| S3 | S2 | S1 | Price | R1 | |
|---|---|---|---|---|---|
| ProTrendLines | 49.69 | 50.63 | 51.72 | 53.31 | 59.73 |
| Change (%) | -6.79% | -5.03% | -2.98% | - | +12.04% |
| Change | -3.62 | -2.68 | -1.59 | - | +6.42 |
| Level | Intermediate | Minor | Major | - | Major |
Attention could also be paid to pivot points to set price objectives:
| Pivot points | S3 | S2 | S1 | PP | R1 | R2 | R3 |
|---|---|---|---|---|---|---|---|
| Standard | 48.56 | 49.17 | 50.06 | 50.67 | 51.56 | 52.17 | 53.06 |
| Camarilla | 50.53 | 50.67 | 50.80 | 50.94 | 51.08 | 51.22 | 51.35 |
| Woodie | 48.69 | 49.24 | 50.19 | 50.74 | 51.69 | 52.24 | 53.19 |
| Fibonacci | 49.17 | 49.75 | 50.10 | 50.67 | 51.25 | 51.60 | 52.17 |
| Pivot points | S3 | S2 | S1 | PP | R1 | R2 | R3 |
|---|---|---|---|---|---|---|---|
| Standard | 45.06 | 46.69 | 48.64 | 50.27 | 52.22 | 53.85 | 55.80 |
| Camarilla | 49.62 | 49.94 | 50.27 | 50.60 | 50.93 | 51.26 | 51.59 |
| Woodie | 45.23 | 46.77 | 48.81 | 50.35 | 52.39 | 53.93 | 55.97 |
| Fibonacci | 46.69 | 48.05 | 48.90 | 50.27 | 51.63 | 52.48 | 53.85 |
| Pivot points | S3 | S2 | S1 | PP | R1 | R2 | R3 |
|---|---|---|---|---|---|---|---|
| Standard | 37.50 | 41.11 | 44.68 | 48.29 | 51.86 | 55.47 | 59.04 |
| Camarilla | 46.29 | 46.94 | 47.60 | 48.26 | 48.92 | 49.58 | 50.24 |
| Woodie | 37.49 | 41.10 | 44.67 | 48.28 | 51.85 | 55.46 | 59.03 |
| Fibonacci | 41.11 | 43.85 | 45.54 | 48.29 | 51.03 | 52.72 | 55.47 |
Numerical data
The following are the details of the technical indicators and moving averages that were collected to generate this technical analysis:
| RSI (14): | 81.03 | |
| MACD (12,26,9): | 0.9800 | |
| Directional Movement: | 37.24 | |
| AROON (14): | 92.86 | |
| DEMA (21): | 52.38 | |
| Parabolic SAR (0,02-0,02-0,2): | 51.35 | |
| Elder Ray (13): | 1.33 | |
| Super Trend (3,10): | 51.87 | |
| Zig ZAG (10): | 53.22 | |
| VORTEX (21): | 1.3400 | |
| Stochastique (14,3,5): | 98.28 | |
| TEMA (21): | 53.18 | |
| Williams %R (14): | -1.21 | |
| Chande Momentum Oscillator (20): | 3.32 | |
| Repulse (5,40,3): | 1.0600 | |
| ROCnROLL: | 1 | |
| TRIX (15,9): | 0.1900 | |
| Courbe Coppock: | 14.28 |
| MA7: | 50.18 | |
| MA20: | 49.50 | |
| MA50: | 46.73 | |
| MA100: | 41.88 | |
| MAexp7: | 52.55 | |
| MAexp20: | 51.26 | |
| MAexp50: | 50.33 | |
| MAexp100: | 49.68 | |
| Price / MA7: | +6.24% | |
| Price / MA20: | +7.70% | |
| Price / MA50: | +14.08% | |
| Price / MA100: | +27.29% | |
| Price / MAexp7: | +1.45% | |
| Price / MAexp20: | +4.00% | |
| Price / MAexp50: | +5.92% | |
| Price / MAexp100: | +7.31% |
About author
Online


Add a comment
Comments
0 comments on the analysis TRIP.COM GROUP LTD. - 1H