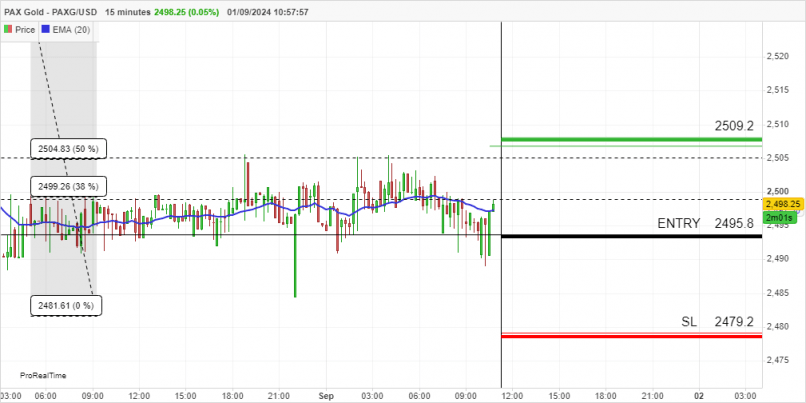
PAX GOLD - PAXG/USD - PAXG/USD | Price retrace at Fibonacci 38% - 50% from Last Downward (15 min) - 09/01/2024 (GMT)
- Who voted?
- 123
- 0
- Chart + Trading signal
- Signal : Sell signal
- |
- Entry price recommended : 2 495,8
- |
- Stop loss : 2 509,2
- |
- Take profit : 2 479,2
- Timeframe : 15 min.

PAX GOLD - PAXG/USD Chart
Are you looking for opportunities in cryptocurrencies?
DISCOVER LONDINIA OPPORTUNITIES...
DISCOVER LONDINIA OPPORTUNITIES...
- HMA(38) Bending moment down Strongly (15 min)
- HMA(38,85) bearish crossovers (15 min)
- EMA(20) and HMA(85) bearish crossovers (15 min)
- Price retrace at Fibonacci 38% - 50% from Last Downward (15 min)
- Momentum (10) Bearish (Daily)
- Hull Moving Average (9) Bearish (Daily)
This member declared having a selling position on this financial instrument or a related financial instrument.
About author

Offline


Add a comment
Comments
0 comments on the analysis PAX GOLD - PAXG/USD - 15 min.