ATLASSIAN CORP. - Daily - Technical analysis published on 07/05/2019 (GMT)
- 561
- 0
- Who voted?
Click here for a new analysis!
- Timeframe : Daily
- - Analysis generated on
- Status : TARGET REACHED

Summary of the analysis

Additional analysis
Quotes
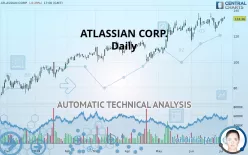
The ATLASSIAN CORP. rating is 133.36 USD. The price registered a decrease of -0.29% on the session and was between 133.22 USD and 135.16 USD. This implies that the price is at +0.11% from its lowest and at -1.33% from its highest.A bullish gap was detected at the opening by the Central Gaps scanner. There are a lot of buyers and they have the upper hand in the very short term.
Opening Gap UP
Type : Bullish
Timeframe : Openning
A study of price movements over other periods shows the following variations:
Near a new HIGH record (1 year)
Type : Bullish
Timeframe : Weekly
Near a new HIGH record (1st january)
Type : Bullish
Timeframe : Weekly
Near a new HIGH record (1 month)
Type : Bullish
Timeframe : Weekly
Technical
Technical analysis of this Daily chart of ATLASSIAN CORP. indicates that the overall trend is strongly bullish. The signals given by the moving averages are 92.86% bullish. This strong bullish trend is confirmed by the strong signals currently being given by short-term moving averages. The Central Indicators market scanner currently does not detect any result that concerns moving averages.
The probability of a further increase are moderate given the direction of the technical indicators.
Caution: the Central Indicators scanner currently detects an excess:
Williams %R indicator is overbought : over -20
Type : Neutral
Timeframe : Daily
Price is back over the pivot point
Type : Bullish
Timeframe : Daily
The analysis of the price chart with Central Patterns scanners does not return any result.
No result was found by the Central Candlesticks scanner on Japanese candlesticks.
| S3 | S2 | S1 | Price | R1 | |
|---|---|---|---|---|---|
| ProTrendLines | 101.94 | 115.58 | 129.56 | 133.36 | 135.05 |
| Change (%) | -23.56% | -13.33% | -2.85% | - | +1.27% |
| Change | -31.42 | -17.78 | -3.80 | - | +1.69 |
| Level | Major | Major | Major | - | Intermediate |
Attention could also be paid to pivot points to set price objectives:
| Pivot points | S3 | S2 | S1 | PP | R1 | R2 | R3 |
|---|---|---|---|---|---|---|---|
| Standard | 129.09 | 130.06 | 131.91 | 132.88 | 134.72 | 135.69 | 137.54 |
| Camarilla | 132.98 | 133.23 | 133.49 | 133.75 | 134.01 | 134.27 | 134.52 |
| Woodie | 129.53 | 130.28 | 132.34 | 133.10 | 135.16 | 135.91 | 137.97 |
| Fibonacci | 130.06 | 131.14 | 131.80 | 132.88 | 133.95 | 134.62 | 135.69 |
| Pivot points | S3 | S2 | S1 | PP | R1 | R2 | R3 |
|---|---|---|---|---|---|---|---|
| Standard | 114.28 | 118.85 | 124.85 | 129.42 | 135.42 | 139.99 | 145.99 |
| Camarilla | 127.93 | 128.90 | 129.87 | 130.84 | 131.81 | 132.78 | 133.75 |
| Woodie | 114.99 | 119.21 | 125.56 | 129.78 | 136.12 | 140.35 | 146.70 |
| Fibonacci | 118.85 | 122.89 | 125.39 | 129.42 | 133.46 | 135.96 | 139.99 |
Numerical data
The following is the status of technical indicators and moving averages registered at the time this technical analysis was created:
| RSI (14): | 58.07 | |
| MACD (12,26,9): | 2.1000 | |
| Directional Movement: | 4.91 | |
| AROON (14): | -21.43 | |
| DEMA (21): | 133.10 | |
| Parabolic SAR (0,02-0,02-0,2): | 136.14 | |
| Elder Ray (13): | 3.11 | |
| Super Trend (3,10): | 122.60 | |
| Zig ZAG (10): | 133.36 | |
| VORTEX (21): | 1.1400 | |
| Stochastique (14,3,5): | 67.97 | |
| TEMA (21): | 132.46 | |
| Williams %R (14): | -29.17 | |
| Chande Momentum Oscillator (20): | 2.71 | |
| Repulse (5,40,3): | -0.0200 | |
| ROCnROLL: | 1 | |
| TRIX (15,9): | 0.2600 | |
| Courbe Coppock: | 3.25 |
| MA7: | 130.69 | |
| MA20: | 130.83 | |
| MA50: | 124.16 | |
| MA100: | 116.51 | |
| MAexp7: | 131.88 | |
| MAexp20: | 130.09 | |
| MAexp50: | 124.88 | |
| MAexp100: | 116.78 | |
| Price / MA7: | +2.04% | |
| Price / MA20: | +1.93% | |
| Price / MA50: | +7.41% | |
| Price / MA100: | +14.46% | |
| Price / MAexp7: | +1.12% | |
| Price / MAexp20: | +2.51% | |
| Price / MAexp50: | +6.79% | |
| Price / MAexp100: | +14.20% |
News
Don"t forget to follow the news on ATLASSIAN CORP.. At the time of publication of this analysis, the latest news was as follows:
- Atlassian Co-CEOs Adopt New 10b5-1 Trading Plans
- SignalFx’s New Integration with Atlassian’s Opsgenie Aims to Attack Digital Disruptions
- Sumo Logic Integration with Atlassian Opsgenie Empowers Customers to Improve Visibility and Monitoring Across Full Incident Management Lifecycle
- Atlassian to Hold Investor Session on April 10, 2019 and Announces Timing of Third Quarter Fiscal Year 2019 Results
- Atlassian to Present at Upcoming Investor Conferences
About author

Online


Add a comment
Comments
0 comments on the analysis ATLASSIAN CORP. - Daily