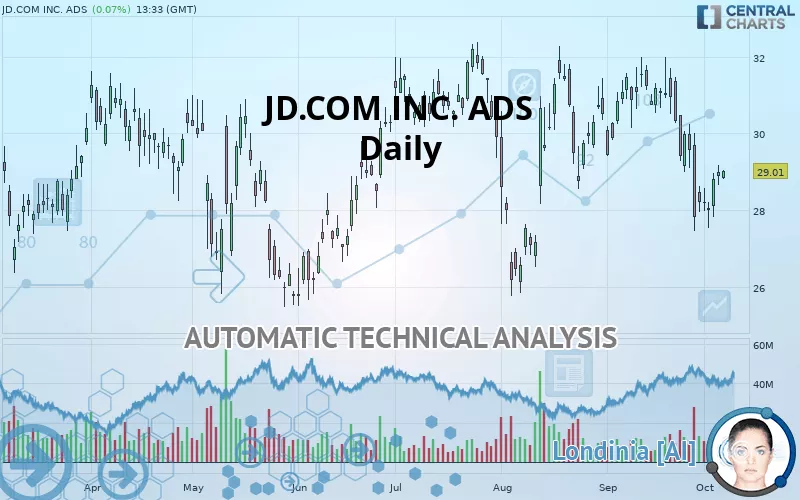
JD.COM INC. ADS - Daily - Technical analysis published on 10/07/2019 (GMT)
- 476
- 0
- Who voted?
Click here for a new analysis!
- Timeframe : Daily
- - Analysis generated on
- Status : TARGET REACHED

Summary of the analysis

Additional analysis
Quotes
The JD.COM INC. ADS price is 29.01 USD. On the day, this instrument gained +0.07% and was traded between 28.80 USD and 29.05 USD over the period. The price is currently at +0.73% from its lowest and -0.14% from its highest.The Central Gaps scanner detects a bullish opening marking the presence of buyers ahead of sellers at the opening but not sufficiently marked to allow the price to register a quotation gap.
Bullish opening
Type : Bullish
Timeframe : Openning
So that you have an overall view of the price change, here is a table showing the variations over several periods:
Near a new LOW record (1 month)
Type : Bearish
Timeframe : Weekly
Technical
A technical analysis in Daily of this JD.COM INC. ADS chart shows a bearish trend. 75% of the signals given by moving averages are bearish. The overall trend is reinforced by the strong bearish signals from short-term moving averages. The Central Indicators scanner detects a bearish signal on moving averages that could impact this trend:
Moving Average bearish crossovers : AMA20 & AMA50
Type : Bearish
Timeframe : Daily
In fact, Central Analyzer took into account 18 technical indicators and the result was as follows: 7 are bullish, 4 are neutral and 7 are bearish. Caution: the Central Indicators scanner currently detects an excess:
CCI indicator is oversold : under -100
Type : Neutral
Timeframe : Daily
Price is back over the pivot point
Type : Bullish
Timeframe : Daily
Price is back under the pivot point
Type : Bearish
Timeframe : Weekly
The analysis of the price chart with Central Patterns scanners does not return any result.
The Central Candlesticks scanner, specialised in Japanese candlesticks, did not identify any signals.
| S3 | S2 | S1 | Price | R1 | R2 | R3 | |
|---|---|---|---|---|---|---|---|
| ProTrendLines | 23.96 | 26.13 | 27.82 | 29.01 | 29.37 | 30.49 | 31.47 |
| Change (%) | -17.41% | -9.93% | -4.10% | - | +1.24% | +5.10% | +8.48% |
| Change | -5.05 | -2.88 | -1.19 | - | +0.36 | +1.48 | +2.46 |
| Level | Minor | Major | Major | - | Intermediate | Intermediate | Major |
To determine price objectives, it is also possible to use the pivot points. Here is the price position in relation to pivot points:
| Pivot points | S3 | S2 | S1 | PP | R1 | R2 | R3 |
|---|---|---|---|---|---|---|---|
| Standard | 26.94 | 27.38 | 28.09 | 28.53 | 29.24 | 29.68 | 30.39 |
| Camarilla | 28.48 | 28.59 | 28.70 | 28.80 | 28.91 | 29.01 | 29.12 |
| Woodie | 27.08 | 27.45 | 28.23 | 28.60 | 29.38 | 29.75 | 30.53 |
| Fibonacci | 27.38 | 27.82 | 28.09 | 28.53 | 28.97 | 29.24 | 29.68 |
| Pivot points | S3 | S2 | S1 | PP | R1 | R2 | R3 |
|---|---|---|---|---|---|---|---|
| Standard | 22.37 | 24.92 | 26.37 | 28.92 | 30.37 | 32.92 | 34.37 |
| Camarilla | 26.72 | 27.09 | 27.45 | 27.82 | 28.19 | 28.55 | 28.92 |
| Woodie | 21.82 | 24.65 | 25.82 | 28.65 | 29.82 | 32.65 | 33.82 |
| Fibonacci | 24.92 | 26.45 | 27.39 | 28.92 | 30.45 | 31.39 | 32.92 |
| Pivot points | S3 | S2 | S1 | PP | R1 | R2 | R3 |
|---|---|---|---|---|---|---|---|
| Standard | 21.92 | 24.70 | 26.45 | 29.23 | 30.98 | 33.76 | 35.51 |
| Camarilla | 26.96 | 27.38 | 27.80 | 28.21 | 28.63 | 29.04 | 29.46 |
| Woodie | 21.42 | 24.44 | 25.95 | 28.97 | 30.48 | 33.50 | 35.01 |
| Fibonacci | 24.70 | 26.43 | 27.50 | 29.23 | 30.96 | 32.03 | 33.76 |
Numerical data
The following is the status of the technical indicators and moving averages at the time of publication of this technical analysis:
| RSI (14): | 44.74 | |
| MACD (12,26,9): | -0.4900 | |
| Directional Movement: | -6.83 | |
| AROON (14): | -42.86 | |
| DEMA (21): | 29.00 | |
| Parabolic SAR (0,02-0,02-0,2): | 29.87 | |
| Elder Ray (13): | -0.30 | |
| Super Trend (3,10): | 30.97 | |
| Zig ZAG (10): | 28.99 | |
| VORTEX (21): | 0.9000 | |
| Stochastique (14,3,5): | 25.31 | |
| TEMA (21): | 28.47 | |
| Williams %R (14): | -66.45 | |
| Chande Momentum Oscillator (20): | -2.05 | |
| Repulse (5,40,3): | 1.0000 | |
| ROCnROLL: | 2 | |
| TRIX (15,9): | -0.1400 | |
| Courbe Coppock: | 15.74 |
| MA7: | 28.44 | |
| MA20: | 30.03 | |
| MA50: | 29.75 | |
| MA100: | 29.40 | |
| MAexp7: | 28.82 | |
| MAexp20: | 29.51 | |
| MAexp50: | 29.76 | |
| MAexp100: | 29.37 | |
| Price / MA7: | +2.00% | |
| Price / MA20: | -3.40% | |
| Price / MA50: | -2.49% | |
| Price / MA100: | -1.33% | |
| Price / MAexp7: | +0.66% | |
| Price / MAexp20: | -1.69% | |
| Price / MAexp50: | -2.52% | |
| Price / MAexp100: | -1.23% |
News
The latest news and videos published on JD.COM INC. ADS at the time of the analysis were as follows:
- Investor Network: JD.com, Inc. to Host Earnings Call
-
 JD.com CEO On Donald Trump’s Impact On Business In China | The Pulse | CNBC
- JD.com Announces Third Quarter 2016 Results
- JD.com to Report Third Quarter 2016 Financial Results on November 15, 2016
- Futbol Club Barcelona to Launch Exclusive Store on JD.com
About author

Online


Add a comment
Comments
0 comments on the analysis JD.COM INC. ADS - Daily