JD.COM INC. ADS - Weekly - Technical analysis published on 04/17/2021 (GMT)
- 443
- 0
Click here for a new analysis!
- Timeframe : Weekly
- - Analysis generated on
- Status : TARGET REACHED
Summary of the analysis

Additional analysis
Quotes
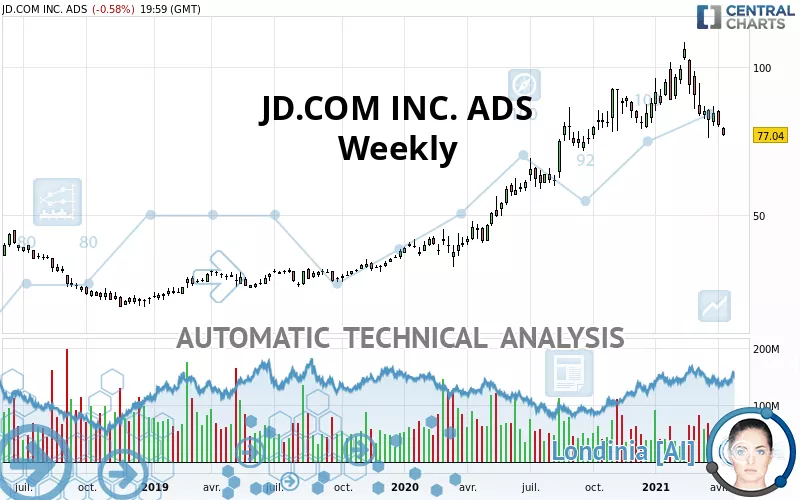
The JD.COM INC. ADS price is 77.04 USD. The price is lower by -4.19% over the 5 days and has been traded over the last 5 days between 76.72 USD and 79.71 USD. This implies that the 5 day price is +0.42% from its lowest point and -3.35% from its highest point.A bearish opening was detected by the Central Gaps scanner. Sellers are trying to impose a bearish trend in the very short term.
Bearish opening
Type : Bearish
Timeframe : Openning
So that you have an overall view of the price change, here is a table showing the variations over several periods:
Near a new LOW record (1st january)
Type : Bearish
Timeframe : Weekly
Near a new LOW record (1 month)
Type : Bearish
Timeframe : Weekly
Technical
Technical analysis of this Weekly chart of JD.COM INC. ADS indicates that the overall trend is bullish. 67.86% of the signals given by moving averages are bullish. Caution: the slightly bearish signals currently being given by short-term moving averages indicate that this bullish trend may be running out of steam. An assessment of moving averages reveals a bearish signal that could impact this trend:
Bearish price crossover with adaptative moving average 100
Type : Bearish
Timeframe : Weekly
In fact, 10 technical indicators on 18 studied are currently positioned bearish. But beware of excesses. The Central Indicators scanner currently detects this:
MACD indicator: bearish divergence
Type : Bullish
Timeframe : Weekly
RSI indicator: bearish divergence
Type : Bearish
Timeframe : Weekly
Williams %R indicator is oversold : under -80
Type : Neutral
Timeframe : Weekly
Pivot points : price is under support 3
Type : Neutral
Timeframe : Weekly
SuperTrend indicator bearish reversal
Type : Bearish
Timeframe : Weekly
Price is back over the pivot point
Type : Bullish
Timeframe : Weekly
The Central Patterns scanner, which studies chart patterns, resistances and supports, has identified this signal:
Near resistance of triangle
Type : Bearish
Timeframe : Weekly
Central Candlesticks, the scanner specialised in Japanese candlesticks, detects a bearish signal that could support the hypothesis of a small drop in the very short term:
Bearish engulfing lines
Type : Bearish
Timeframe : Weekly
| S3 | S2 | S1 | Price | R1 | R2 | R3 | |
|---|---|---|---|---|---|---|---|
| ProTrendLines | 19.32 | 31.70 | 50.50 | 77.04 | 79.62 | 92.49 | 106.88 |
| Change (%) | -74.92% | -58.85% | -34.45% | - | +3.35% | +20.05% | +38.73% |
| Change | -57.72 | -45.34 | -26.54 | - | +2.58 | +15.45 | +29.84 |
| Level | Minor | Minor | Minor | - | Major | Intermediate | Major |
Pivot points can also be used to set your price objectives. Here is the price situation in relation to pivot points:
| Pivot points | S3 | S2 | S1 | PP | R1 | R2 | R3 |
|---|---|---|---|---|---|---|---|
| Standard | 75.56 | 76.14 | 76.59 | 77.17 | 77.62 | 78.20 | 78.65 |
| Camarilla | 76.76 | 76.85 | 76.95 | 77.04 | 77.13 | 77.23 | 77.32 |
| Woodie | 75.50 | 76.11 | 76.53 | 77.14 | 77.56 | 78.17 | 78.59 |
| Fibonacci | 76.14 | 76.53 | 76.78 | 77.17 | 77.56 | 77.81 | 78.20 |
| Pivot points | S3 | S2 | S1 | PP | R1 | R2 | R3 |
|---|---|---|---|---|---|---|---|
| Standard | 72.43 | 76.09 | 78.25 | 81.91 | 84.07 | 87.73 | 89.89 |
| Camarilla | 78.81 | 79.34 | 79.88 | 80.41 | 80.94 | 81.48 | 82.01 |
| Woodie | 71.68 | 75.72 | 77.50 | 81.54 | 83.32 | 87.36 | 89.14 |
| Fibonacci | 76.09 | 78.31 | 79.69 | 81.91 | 84.13 | 85.51 | 87.73 |
| Pivot points | S3 | S2 | S1 | PP | R1 | R2 | R3 |
|---|---|---|---|---|---|---|---|
| Standard | 51.47 | 63.79 | 74.06 | 86.38 | 96.65 | 108.97 | 119.24 |
| Camarilla | 78.12 | 80.19 | 82.26 | 84.33 | 86.40 | 88.47 | 90.54 |
| Woodie | 50.45 | 63.28 | 73.04 | 85.87 | 95.63 | 108.46 | 118.22 |
| Fibonacci | 63.79 | 72.42 | 77.75 | 86.38 | 95.01 | 100.34 | 108.97 |
Numerical data
The following are the details of the technical indicators and moving averages that were collected to generate this technical analysis:
| RSI (14): | 43.18 | |
| MACD (12,26,9): | 1.1300 | |
| Directional Movement: | -1.93 | |
| AROON (14): | -35.71 | |
| DEMA (21): | 88.82 | |
| Parabolic SAR (0,02-0,02-0,2): | 101.58 | |
| Elder Ray (13): | -7.51 | |
| Super Trend (3,10): | 101.90 | |
| Zig ZAG (10): | 77.04 | |
| VORTEX (21): | 0.8900 | |
| Stochastique (14,3,5): | 13.91 | |
| TEMA (21): | 83.79 | |
| Williams %R (14): | -97.11 | |
| Chande Momentum Oscillator (20): | -17.87 | |
| Repulse (5,40,3): | -9.7300 | |
| ROCnROLL: | -1 | |
| TRIX (15,9): | 0.7200 | |
| Courbe Coppock: | 7.41 |
| MA7: | 78.95 | |
| MA20: | 81.33 | |
| MA50: | 89.14 | |
| MA100: | 88.42 | |
| MAexp7: | 83.36 | |
| MAexp20: | 85.65 | |
| MAexp50: | 76.48 | |
| MAexp100: | 63.24 | |
| Price / MA7: | -2.42% | |
| Price / MA20: | -5.27% | |
| Price / MA50: | -13.57% | |
| Price / MA100: | -12.87% | |
| Price / MAexp7: | -7.58% | |
| Price / MAexp20: | -10.05% | |
| Price / MAexp50: | +0.73% | |
| Price / MAexp100: | +21.82% |
News
Don"t forget to follow the news on JD.COM INC. ADS. At the time of publication of this analysis, the latest news was as follows:
- Investor Network: JD.com, Inc. to Host Earnings Call
-
 JD.com CEO On Donald Trump’s Impact On Business In China | The Pulse | CNBC
- JD.com Announces Third Quarter 2016 Results
- JD.com to Report Third Quarter 2016 Financial Results on November 15, 2016
- Futbol Club Barcelona to Launch Exclusive Store on JD.com
About author

Online


Add a comment
Comments
0 comments on the analysis JD.COM INC. ADS - Weekly