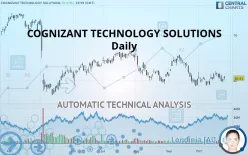
COGNIZANT TECHNOLOGY SOLUTIONS - Daily - Technical analysis published on 10/25/2019 (GMT)
- 463
- 0
- Who voted?
Click here for a new analysis!
- Timeframe : Daily
- - Analysis generated on
- Status : INVALID

Summary of the analysis

Additional analysis
Quotes
The COGNIZANT TECHNOLOGY SOLUTIONS rating is 60.51 USD. The price registered an increase of +0.27% on the session and was between 60.18 USD and 61.00 USD. This implies that the price is at +0.55% from its lowest and at -0.80% from its highest.A bullish gap was detected at the opening by the Central Gaps scanner. There are a lot of buyers and they have the upper hand in the very short term.
Opening Gap UP
Type : Bullish
Timeframe : Openning
A study of price movements over other periods shows the following variations:
Technical
Technical analysis of COGNIZANT TECHNOLOGY SOLUTIONS in Daily shows a overall strongly bearish trend. 82.14% of the signals given by moving averages are bearish. Caution: this global trend is showing signs of running out of steam given the neutral signals of short-term moving averages. An assessment of moving averages reveals several bullish signals that could impact this trend:
Bullish trend reversal : Moving Average 20
Type : Bullish
Timeframe : Daily
Bullish price crossover with Moving Average 20
Type : Bullish
Timeframe : Daily
The probability of a further increase is slight given the direction of the technical indicators.
Other results related to technical indicators were also found by the Central Indicators scanner:
Parabolic SAR indicator bearish reversal
Type : Bearish
Timeframe : Daily
Price is back over the pivot point
Type : Bullish
Timeframe : Daily
Momentum indicator is back over 0
Type : Bullish
Timeframe : Daily
The analysis of the price chart with Central Patterns scanners does not return any result.
The presence of a bullish Japanese candlestick pattern detected by Central Candlesticks that could cause a very short term rebound was also detected:
Bullish harami
Type : Bullish
Timeframe : Daily
| S3 | S2 | S1 | Price | R1 | R2 | R3 | |
|---|---|---|---|---|---|---|---|
| ProTrendLines | 51.68 | 56.88 | 59.50 | 60.51 | 61.39 | 66.41 | 69.87 |
| Change (%) | -14.59% | -6.00% | -1.67% | - | +1.45% | +9.75% | +15.47% |
| Change | -8.83 | -3.63 | -1.01 | - | +0.88 | +5.90 | +9.36 |
| Level | Minor | Minor | Major | - | Major | Major | Intermediate |
Pivot points can also be used to set your price objectives. Here is the price situation in relation to pivot points:
| Pivot points | S3 | S2 | S1 | PP | R1 | R2 | R3 |
|---|---|---|---|---|---|---|---|
| Standard | 59.06 | 59.32 | 59.84 | 60.10 | 60.62 | 60.88 | 61.40 |
| Camarilla | 60.14 | 60.21 | 60.28 | 60.35 | 60.42 | 60.49 | 60.57 |
| Woodie | 59.18 | 59.39 | 59.96 | 60.17 | 60.74 | 60.95 | 61.52 |
| Fibonacci | 59.32 | 59.62 | 59.81 | 60.10 | 60.40 | 60.59 | 60.88 |
| Pivot points | S3 | S2 | S1 | PP | R1 | R2 | R3 |
|---|---|---|---|---|---|---|---|
| Standard | 57.82 | 58.92 | 59.78 | 60.88 | 61.74 | 62.84 | 63.70 |
| Camarilla | 60.10 | 60.28 | 60.46 | 60.64 | 60.82 | 61.00 | 61.18 |
| Woodie | 57.70 | 58.86 | 59.66 | 60.82 | 61.62 | 62.78 | 63.58 |
| Fibonacci | 58.92 | 59.67 | 60.13 | 60.88 | 61.63 | 62.09 | 62.84 |
| Pivot points | S3 | S2 | S1 | PP | R1 | R2 | R3 |
|---|---|---|---|---|---|---|---|
| Standard | 50.44 | 54.55 | 57.41 | 61.51 | 64.37 | 68.48 | 71.34 |
| Camarilla | 58.35 | 58.99 | 59.63 | 60.27 | 60.90 | 61.54 | 62.18 |
| Woodie | 49.82 | 54.24 | 56.78 | 61.20 | 63.75 | 68.17 | 70.71 |
| Fibonacci | 54.55 | 57.21 | 58.85 | 61.51 | 64.17 | 65.82 | 68.48 |
Numerical data
The following is the status of the technical indicators and moving averages at the time of publication of this technical analysis:
| RSI (14): | 47.45 | |
| MACD (12,26,9): | -0.2900 | |
| Directional Movement: | -1.41 | |
| AROON (14): | 42.85 | |
| DEMA (21): | 60.22 | |
| Parabolic SAR (0,02-0,02-0,2): | 61.93 | |
| Elder Ray (13): | 0.04 | |
| Super Trend (3,10): | 62.78 | |
| Zig ZAG (10): | 60.51 | |
| VORTEX (21): | 0.9800 | |
| Stochastique (14,3,5): | 44.12 | |
| TEMA (21): | 60.37 | |
| Williams %R (14): | -47.57 | |
| Chande Momentum Oscillator (20): | 1.61 | |
| Repulse (5,40,3): | -1.4000 | |
| ROCnROLL: | 2 | |
| TRIX (15,9): | -0.1000 | |
| Courbe Coppock: | 2.20 |
| MA7: | 60.71 | |
| MA20: | 60.30 | |
| MA50: | 61.41 | |
| MA100: | 62.66 | |
| MAexp7: | 60.51 | |
| MAexp20: | 60.68 | |
| MAexp50: | 61.45 | |
| MAexp100: | 62.69 | |
| Price / MA7: | -0.33% | |
| Price / MA20: | +0.35% | |
| Price / MA50: | -1.47% | |
| Price / MA100: | -3.43% | |
| Price / MAexp7: | -0% | |
| Price / MAexp20: | -0.28% | |
| Price / MAexp50: | -1.53% | |
| Price / MAexp100: | -3.48% |
News
Don"t forget to follow the news on COGNIZANT TECHNOLOGY SOLUTIONS. At the time of publication of this analysis, the latest news was as follows:
- Cognizant Named an RPA Services Leader by Independent Research Firm
- SHAREHOLDER ALERT: Purcell Julie & Lefkowitz LLP Is Investigating Cognizant Technology Solutions Corporation for Potential Breaches of Fiduciary Duty By Its Board of Directors
- Cognizant Positioned as a Leader in Life Sciences Digital Services for Second Year in a Row
- Cognizant to Acquire Contino, a Premier Enterprise DevOps and Cloud Transformation Consultancy
- Cognizant to Acquire Contino, a Premier Enterprise DevOps and Cloud Transformation Consultancy
About author

Online


Add a comment
Comments
0 comments on the analysis COGNIZANT TECHNOLOGY SOLUTIONS - Daily