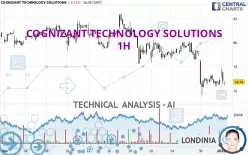
COGNIZANT TECHNOLOGY SOLUTIONS - 1H - Technical analysis published on 01/02/2025 (GMT)
- 118
- 0
Click here for a new analysis!
- Timeframe : 1H
- - Analysis generated on
- Status : LEVEL MAINTAINED

Summary of the analysis

Additional analysis
Quotes
The COGNIZANT TECHNOLOGY SOLUTIONS price is 76.74 USD. On the day, this instrument lost -0.21% with the lowest point at 76.44 USD and the highest point at 77.86 USD. The deviation from the price is +0.39% for the low point and -1.44% for the high point.The Central Gaps scanner detects the formation of a bullish gap marking the strong presence of buyers against sellers at the opening. This formed a quotation gap.
Opening Gap UP
Type : Bullish
Timeframe : Openning
A study of price movements over other periods shows the following variations:
Near a new LOW record (1st january)
Type : Bearish
Timeframe : Weekly
Near a new LOW record (1 month)
Type : Bearish
Timeframe : Weekly
Technical
A technical analysis in 1H of this COGNIZANT TECHNOLOGY SOLUTIONS chart shows a sharp bearish trend. 92.86% of the signals given by moving averages are bearish. The overall trend is supported by the strong bearish signals from short-term moving averages. There is no crossing of moving average by the price or crossing of moving averages between themselves.
The technical indicators are generally neutral. They do not provide relevant information on the direction of future price movements.
Caution: the Central Indicators scanner currently detects an excess:
Williams %R indicator is oversold : under -80
Type : Neutral
Timeframe : 1 hour
Pivot points : price is under support 3
Type : Neutral
Timeframe : Weekly
The analysis of the price chart with Central Patterns scanners does not return any result.
The presence of a bullish Japanese candlestick pattern detected by Central Candlesticks that could cause a very short term rebound was also detected:
Bullish doji star
Type : Bullish
Timeframe : 1 hour
| S3 | S2 | S1 | Price | R1 | R2 | R3 | |
|---|---|---|---|---|---|---|---|
| ProTrendLines | 69.49 | 74.11 | 75.63 | 76.74 | 77.10 | 78.24 | 80.02 |
| Change (%) | -9.45% | -3.43% | -1.45% | - | +0.47% | +1.95% | +4.27% |
| Change | -7.25 | -2.63 | -1.11 | - | +0.36 | +1.50 | +3.28 |
| Level | Minor | Major | Intermediate | - | Major | Minor | Intermediate |
Pivot points can also be used to set your price objectives. Here is the price situation in relation to pivot points:
| Pivot points | S3 | S2 | S1 | PP | R1 | R2 | R3 |
|---|---|---|---|---|---|---|---|
| Standard | 75.38 | 75.86 | 76.38 | 76.86 | 77.38 | 77.86 | 78.38 |
| Camarilla | 76.63 | 76.72 | 76.81 | 76.90 | 76.99 | 77.08 | 77.18 |
| Woodie | 75.40 | 75.87 | 76.40 | 76.87 | 77.40 | 77.87 | 78.40 |
| Fibonacci | 75.86 | 76.24 | 76.48 | 76.86 | 77.24 | 77.48 | 77.86 |
| Pivot points | S3 | S2 | S1 | PP | R1 | R2 | R3 |
|---|---|---|---|---|---|---|---|
| Standard | 76.94 | 77.76 | 78.48 | 79.30 | 80.02 | 80.84 | 81.56 |
| Camarilla | 78.78 | 78.92 | 79.06 | 79.20 | 79.34 | 79.48 | 79.62 |
| Woodie | 76.89 | 77.74 | 78.43 | 79.28 | 79.97 | 80.82 | 81.51 |
| Fibonacci | 77.76 | 78.35 | 78.71 | 79.30 | 79.89 | 80.25 | 80.84 |
| Pivot points | S3 | S2 | S1 | PP | R1 | R2 | R3 |
|---|---|---|---|---|---|---|---|
| Standard | 67.37 | 71.50 | 74.20 | 78.33 | 81.03 | 85.16 | 87.86 |
| Camarilla | 75.02 | 75.65 | 76.27 | 76.90 | 77.53 | 78.15 | 78.78 |
| Woodie | 66.66 | 71.14 | 73.49 | 77.97 | 80.32 | 84.80 | 87.15 |
| Fibonacci | 71.50 | 74.11 | 75.72 | 78.33 | 80.94 | 82.55 | 85.16 |
Numerical data
The following is the status of technical indicators and moving averages registered at the time this technical analysis was created:
| RSI (14): | 39.65 | |
| MACD (12,26,9): | -0.5400 | |
| Directional Movement: | -12.36 | |
| AROON (14): | 85.71 | |
| DEMA (21): | 76.55 | |
| Parabolic SAR (0,02-0,02-0,2): | 75.72 | |
| Elder Ray (13): | -0.41 | |
| Super Trend (3,10): | 78.16 | |
| Zig ZAG (10): | 76.63 | |
| VORTEX (21): | 0.7900 | |
| Stochastique (14,3,5): | 44.76 | |
| TEMA (21): | 76.45 | |
| Williams %R (14): | -83.01 | |
| Chande Momentum Oscillator (20): | -0.25 | |
| Repulse (5,40,3): | -0.7900 | |
| ROCnROLL: | 2 | |
| TRIX (15,9): | -0.1200 | |
| Courbe Coppock: | 1.83 |
| MA7: | 78.28 | |
| MA20: | 79.57 | |
| MA50: | 78.57 | |
| MA100: | 77.31 | |
| MAexp7: | 76.88 | |
| MAexp20: | 77.31 | |
| MAexp50: | 78.25 | |
| MAexp100: | 79.01 | |
| Price / MA7: | -1.97% | |
| Price / MA20: | -3.56% | |
| Price / MA50: | -2.33% | |
| Price / MA100: | -0.74% | |
| Price / MAexp7: | -0.18% | |
| Price / MAexp20: | -0.74% | |
| Price / MAexp50: | -1.93% | |
| Price / MAexp100: | -2.87% |
News
The latest news and videos published on COGNIZANT TECHNOLOGY SOLUTIONS at the time of the analysis were as follows:
- Cognizant First to Achieve ISO/IEC 42001:2023 Accredited Certification for Artificial Intelligence Management Systems
- Cognizant Named to Newsweek's List of America's Greatest Workplaces for Diversity
- Beyond Bank and Cognizant join forces to lead the future of customer-owned banking
- Beyond Bank and Cognizant join forces to lead the future of customer-owned banking
- Cognizant to Present at the Nasdaq Investor Conference
About author
Online


Add a comment
Comments
0 comments on the analysis COGNIZANT TECHNOLOGY SOLUTIONS - 1H