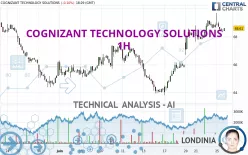
COGNIZANT TECHNOLOGY SOLUTIONS - 1H - Technical analysis published on 06/25/2024 (GMT)
- 229
- 0
Click here for a new analysis!
- Timeframe : 1H
- - Analysis generated on
- Status : LEVEL MAINTAINED

Summary of the analysis

Additional analysis
Quotes
COGNIZANT TECHNOLOGY SOLUTIONS rating 68.61 USD. The price is lower by -0.10% since the last closing and was between 68.30 USD and 69.69 USD. This implies that the price is at +0.45% from its lowest and at -1.55% from its highest.The Central Gaps scanner detects a bullish opening marking the presence of buyers ahead of sellers at the opening but not sufficiently marked to allow the price to register a quotation gap.
Bullish opening
Type : Bullish
Timeframe : Openning
A study of price movements over other periods shows the following variations:
New HIGH record (1 month)
Type : Bullish
Timeframe : Weekly
Technical
Technical analysis of COGNIZANT TECHNOLOGY SOLUTIONS in 1H shows a strongly overall bullish trend. 92.86% of the signals given by moving averages are bullish. The overall trend is supported by the strong bullish signals from short-term moving averages. An assessment of moving averages reveals a bullish signal that could impact this trend:
Bullish price crossover with Moving Average 20
Type : Bullish
Timeframe : 1 hour
In fact, of the 18 technical indicators analysed by Central Analyzer, 5 are bullish, 6 are neutral and 7 are bearish. Central Indicators, the scanner specialised in technical indicators, has identified this signal:
Momentum indicator is back under 0
Type : Bearish
Timeframe : 1 hour
Central Patterns, the market scanner focusing on chart patterns, resistances and supports found this result:
Near support of channel
Type : Bullish
Timeframe : 1 hour
For a small setback in the very short term, the Central Candlesticks scanner currently notes the presence of this bearish pattern in Japanese candlesticks:
Bearish harami
Type : Bearish
Timeframe : 1 hour
Bearish harami cross
Type : Bearish
Timeframe : 1 hour
| S3 | S2 | S1 | Price | R1 | R2 | R3 | |
|---|---|---|---|---|---|---|---|
| ProTrendLines | 64.80 | 66.13 | 67.25 | 68.61 | 68.83 | 69.68 | 70.42 |
| Change (%) | -5.55% | -3.61% | -1.98% | - | +0.32% | +1.56% | +2.64% |
| Change | -3.81 | -2.48 | -1.36 | - | +0.22 | +1.07 | +1.81 |
| Level | Major | Minor | Intermediate | - | Major | Intermediate | Minor |
Attention could also be paid to pivot points to set price objectives:
| Pivot points | S3 | S2 | S1 | PP | R1 | R2 | R3 |
|---|---|---|---|---|---|---|---|
| Standard | 66.87 | 67.44 | 68.06 | 68.63 | 69.25 | 69.82 | 70.44 |
| Camarilla | 68.35 | 68.46 | 68.57 | 68.68 | 68.79 | 68.90 | 69.01 |
| Woodie | 66.90 | 67.45 | 68.09 | 68.64 | 69.28 | 69.83 | 70.47 |
| Fibonacci | 67.44 | 67.90 | 68.18 | 68.63 | 69.09 | 69.37 | 69.82 |
| Pivot points | S3 | S2 | S1 | PP | R1 | R2 | R3 |
|---|---|---|---|---|---|---|---|
| Standard | 60.13 | 61.96 | 65.15 | 66.98 | 70.17 | 72.00 | 75.19 |
| Camarilla | 66.96 | 67.42 | 67.88 | 68.34 | 68.80 | 69.26 | 69.72 |
| Woodie | 60.81 | 62.30 | 65.83 | 67.32 | 70.85 | 72.34 | 75.87 |
| Fibonacci | 61.96 | 63.88 | 65.06 | 66.98 | 68.90 | 70.08 | 72.00 |
| Pivot points | S3 | S2 | S1 | PP | R1 | R2 | R3 |
|---|---|---|---|---|---|---|---|
| Standard | 57.47 | 60.92 | 63.53 | 66.98 | 69.59 | 73.04 | 75.65 |
| Camarilla | 64.48 | 65.04 | 65.60 | 66.15 | 66.71 | 67.26 | 67.82 |
| Woodie | 57.06 | 60.71 | 63.12 | 66.77 | 69.18 | 72.83 | 75.24 |
| Fibonacci | 60.92 | 63.23 | 64.66 | 66.98 | 69.29 | 70.72 | 73.04 |
Numerical data
The following is the status of the technical indicators and moving averages at the time of publication of this technical analysis:
| RSI (14): | 59.53 | |
| MACD (12,26,9): | 0.4200 | |
| Directional Movement: | 17.02 | |
| AROON (14): | 64.29 | |
| DEMA (21): | 68.96 | |
| Parabolic SAR (0,02-0,02-0,2): | 69.66 | |
| Elder Ray (13): | -0.03 | |
| Super Trend (3,10): | 67.83 | |
| Zig ZAG (10): | 68.58 | |
| VORTEX (21): | 1.0300 | |
| Stochastique (14,3,5): | 32.11 | |
| TEMA (21): | 68.86 | |
| Williams %R (14): | -62.42 | |
| Chande Momentum Oscillator (20): | -0.20 | |
| Repulse (5,40,3): | -0.0500 | |
| ROCnROLL: | 1 | |
| TRIX (15,9): | 0.1300 | |
| Courbe Coppock: | 1.17 |
| MA7: | 67.05 | |
| MA20: | 66.36 | |
| MA50: | 66.99 | |
| MA100: | 71.09 | |
| MAexp7: | 68.56 | |
| MAexp20: | 68.31 | |
| MAexp50: | 67.46 | |
| MAexp100: | 66.94 | |
| Price / MA7: | +2.33% | |
| Price / MA20: | +3.39% | |
| Price / MA50: | +2.42% | |
| Price / MA100: | -3.49% | |
| Price / MAexp7: | +0.07% | |
| Price / MAexp20: | +0.44% | |
| Price / MAexp50: | +1.70% | |
| Price / MAexp100: | +2.49% |
News
The latest news and videos published on COGNIZANT TECHNOLOGY SOLUTIONS at the time of the analysis were as follows:
- Cognizant and Gentherm Sign Agreement for Strategic Product Engineering Services and Development of a New Delivery Center
- Cognizant Launches First Set Of Healthcare Large Language Model Solutions As Part Of Generative AI Partnership With Google Cloud
- Driving Experience Reliability in Workplace IT: Cognizant WorkNEXT Workplace Intelligence Powered by Nexthink
-
 Biden is not cognizant of the fact that Trump will wipe the floor with him: Piro #shorts
- Cognizant to Present at Upcoming Conferences
About author
Online


Add a comment
Comments
0 comments on the analysis COGNIZANT TECHNOLOGY SOLUTIONS - 1H