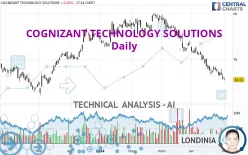
COGNIZANT TECHNOLOGY SOLUTIONS - Daily - Technical analysis published on 05/01/2024 (GMT)
- 205
- 0
Click here for a new analysis!
- Timeframe : Daily
- - Analysis generated on
- Status : LEVEL MAINTAINED

Summary of the analysis

Additional analysis
Quotes
The COGNIZANT TECHNOLOGY SOLUTIONS price is 65.55 USD. The price registered a decrease of -0.20% on the session with the lowest point at 65.30 USD and the highest point at 65.99 USD. The deviation from the price is +0.38% for the low point and -0.67% for the high point.A bearish gap was detected at the opening by the Central Gaps scanner. There are a lot of sellers and they have the upper hand in the very short term.
Opening Gap DOWN
Type : Bearish
Timeframe : Openning
Here is a more detailed summary of the historical variations registered by COGNIZANT TECHNOLOGY SOLUTIONS:
New LOW record (1st january)
Type : Bearish
Timeframe : Weekly
New LOW record (1 month)
Type : Bearish
Timeframe : Weekly
Technical
Technical analysis of this Daily chart of COGNIZANT TECHNOLOGY SOLUTIONS indicates that the overall trend is strongly bearish. The signals given by moving averages are 92.86% bearish. This strong bearish trend is confirmed by the strong signals currently being given by short-term moving averages. The Central Indicators scanner does not detect any result on moving averages that would impact this trend.
An assessment of technical indicators shows a bearish signal.
But beware of excesses. The Central Indicators scanner currently detects this:
RSI indicator is oversold : under 30
Type : Neutral
Timeframe : Daily
CCI indicator is oversold : under -100
Type : Neutral
Timeframe : Daily
Williams %R indicator is oversold : under -80
Type : Neutral
Timeframe : Daily
Pivot points : price is under support 1
Type : Neutral
Timeframe : Weekly
An analysis of the price chart with the Central Patterns scanner (detector of chart patterns and resistances and supports) shows several results that can have an impact on the price change:
Near support of channel
Type : Bullish
Timeframe : Daily
Horizontal support is broken
Type : Bearish
Timeframe : Daily
The Central Candlesticks scanner which studies Japanese candlesticks did not detect anything.
| S3 | S2 | S1 | Price | R1 | R2 | R3 | |
|---|---|---|---|---|---|---|---|
| ProTrendLines | 50.60 | 56.09 | 63.59 | 65.55 | 65.93 | 69.12 | 71.10 |
| Change (%) | -22.81% | -14.43% | -2.99% | - | +0.58% | +5.45% | +8.47% |
| Change | -14.95 | -9.46 | -1.96 | - | +0.38 | +3.57 | +5.55 |
| Level | Major | Minor | Major | - | Intermediate | Major | Major |
Pivot points can also be used to set your price objectives. Here is the price situation in relation to pivot points:
| Pivot points | S3 | S2 | S1 | PP | R1 | R2 | R3 |
|---|---|---|---|---|---|---|---|
| Standard | 63.99 | 64.77 | 65.23 | 66.01 | 66.47 | 67.25 | 67.71 |
| Camarilla | 65.34 | 65.45 | 65.57 | 65.68 | 65.79 | 65.91 | 66.02 |
| Woodie | 63.82 | 64.69 | 65.06 | 65.93 | 66.30 | 67.17 | 67.54 |
| Fibonacci | 64.77 | 65.25 | 65.54 | 66.01 | 66.49 | 66.78 | 67.25 |
| Pivot points | S3 | S2 | S1 | PP | R1 | R2 | R3 |
|---|---|---|---|---|---|---|---|
| Standard | 63.56 | 64.88 | 65.91 | 67.23 | 68.26 | 69.58 | 70.61 |
| Camarilla | 66.29 | 66.51 | 66.73 | 66.94 | 67.16 | 67.37 | 67.59 |
| Woodie | 63.42 | 64.81 | 65.77 | 67.16 | 68.12 | 69.51 | 70.47 |
| Fibonacci | 64.88 | 65.78 | 66.33 | 67.23 | 68.13 | 68.68 | 69.58 |
| Pivot points | S3 | S2 | S1 | PP | R1 | R2 | R3 |
|---|---|---|---|---|---|---|---|
| Standard | 55.97 | 60.77 | 63.22 | 68.02 | 70.47 | 75.27 | 77.72 |
| Camarilla | 63.69 | 64.35 | 65.02 | 65.68 | 66.35 | 67.01 | 67.67 |
| Woodie | 54.81 | 60.18 | 62.06 | 67.43 | 69.31 | 74.68 | 76.56 |
| Fibonacci | 60.77 | 63.54 | 65.25 | 68.02 | 70.79 | 72.50 | 75.27 |
Numerical data
The following is the status of the technical indicators and moving averages at the time of publication of this technical analysis:
| RSI (14): | 23.94 | |
| MACD (12,26,9): | -1.9100 | |
| Directional Movement: | -22.78 | |
| AROON (14): | -100.00 | |
| DEMA (21): | 65.83 | |
| Parabolic SAR (0,02-0,02-0,2): | 67.89 | |
| Elder Ray (13): | -1.75 | |
| Super Trend (3,10): | 68.89 | |
| Zig ZAG (10): | 65.55 | |
| VORTEX (21): | 0.6900 | |
| Stochastique (14,3,5): | 4.70 | |
| TEMA (21): | 65.38 | |
| Williams %R (14): | -94.74 | |
| Chande Momentum Oscillator (20): | -2.86 | |
| Repulse (5,40,3): | -2.0100 | |
| ROCnROLL: | 2 | |
| TRIX (15,9): | -0.3900 | |
| Courbe Coppock: | 10.71 |
| MA7: | 66.68 | |
| MA20: | 68.43 | |
| MA50: | 72.93 | |
| MA100: | 74.16 | |
| MAexp7: | 66.54 | |
| MAexp20: | 68.38 | |
| MAexp50: | 71.18 | |
| MAexp100: | 71.98 | |
| Price / MA7: | -1.69% | |
| Price / MA20: | -4.21% | |
| Price / MA50: | -10.12% | |
| Price / MA100: | -11.61% | |
| Price / MAexp7: | -1.49% | |
| Price / MAexp20: | -4.14% | |
| Price / MAexp50: | -7.91% | |
| Price / MAexp100: | -8.93% |
News
The latest news and videos published on COGNIZANT TECHNOLOGY SOLUTIONS at the time of the analysis were as follows:
- Cognizant enters into a strategic partnership with Telstra to elevate software engineering capabilities and enhance customer experience
- Cognizant enters into a strategic partnership with Telstra to elevate software engineering capabilities and enhance customer experience
- Cognizant's Bluebolt Program Delivers More Than $150M in Estimated Annualized Cost Savings for Enterprises
- Cognizant and FICO Partner to Help Banks Prevent Real-Time Payments Fraud
- Cognizant Has Awarded $70 Million to Advance Globally Diverse Communities
About author
Online


Add a comment
Comments
0 comments on the analysis COGNIZANT TECHNOLOGY SOLUTIONS - Daily