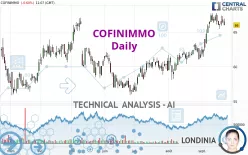
COFINIMMO - Daily - Technical analysis published on 09/23/2024 (GMT)
- 126
- 0
Click here for a new analysis!
- Timeframe : Daily
- - Analysis generated on
- Status : TARGET REACHED

Summary of the analysis

Additional analysis
Quotes
The COFINIMMO rating is 66.00 EUR. The price registered a decrease of -0.60% on the session and was between 66.00 EUR and 66.95 EUR. This implies that the price is at 0% from its lowest and at -1.42% from its highest.A bullish opening was detected by the Central Gaps scanner. Buyers are trying to impose a bullish momentum in the very short term.
Bullish opening
Type : Bullish
Timeframe : Openning
So that you have an overall view of the price change, here is a table showing the variations over several periods:
Near a new HIGH record (1 year)
Type : Bullish
Timeframe : Weekly
Near a new HIGH record (1st january)
Type : Bullish
Timeframe : Weekly
Near a new HIGH record (1 month)
Type : Bullish
Timeframe : Weekly
Technical
A technical analysis in Daily of this COFINIMMO chart shows a strongly bullish trend. 92.86% of the signals given by moving averages are bullish. This strongly bullish trend is supported by the strong bullish signals given by short-term moving averages. There is no crossing of moving average by the price or crossing of moving averages between themselves.
An assessment of technical indicators does not currently provide any relevant information to suggest whether the signal given by the technical indicators is more bullish or bearish.
Central Indicators, the scanner specialised in technical indicators, has identified this signal:
Pivot points : price is under support 1
Type : Neutral
Timeframe : Daily
The Central Patterns scanner, which studies chart patterns, resistances and supports, has identified this signal:
Near support of channel
Type : Bullish
Timeframe : Daily
The Central Candlesticks scanner, specialised in Japanese candlesticks, did not identify any signals.
| S3 | S2 | S1 | Price | R1 | R2 | R3 | |
|---|---|---|---|---|---|---|---|
| ProTrendLines | 55.43 | 61.13 | 65.62 | 66.00 | 67.40 | 73.39 | 78.87 |
| Change (%) | -16.02% | -7.38% | -0.58% | - | +2.12% | +11.20% | +19.50% |
| Change | -10.57 | -4.87 | -0.38 | - | +1.40 | +7.39 | +12.87 |
| Level | Major | Major | Major | - | Major | Minor | Minor |
Pivot points can also be used to set your price objectives. Here is the price situation in relation to pivot points:
| Pivot points | S3 | S2 | S1 | PP | R1 | R2 | R3 |
|---|---|---|---|---|---|---|---|
| Standard | 65.12 | 65.73 | 66.07 | 66.68 | 67.02 | 67.63 | 67.97 |
| Camarilla | 66.14 | 66.23 | 66.31 | 66.40 | 66.49 | 66.57 | 66.66 |
| Woodie | 64.98 | 65.66 | 65.93 | 66.61 | 66.88 | 67.56 | 67.83 |
| Fibonacci | 65.73 | 66.10 | 66.32 | 66.68 | 67.05 | 67.27 | 67.63 |
| Pivot points | S3 | S2 | S1 | PP | R1 | R2 | R3 |
|---|---|---|---|---|---|---|---|
| Standard | 63.02 | 64.23 | 65.32 | 66.53 | 67.62 | 68.83 | 69.92 |
| Camarilla | 65.77 | 65.98 | 66.19 | 66.40 | 66.61 | 66.82 | 67.03 |
| Woodie | 62.95 | 64.20 | 65.25 | 66.50 | 67.55 | 68.80 | 69.85 |
| Fibonacci | 64.23 | 65.11 | 65.66 | 66.53 | 67.41 | 67.96 | 68.83 |
| Pivot points | S3 | S2 | S1 | PP | R1 | R2 | R3 |
|---|---|---|---|---|---|---|---|
| Standard | 53.55 | 55.85 | 58.80 | 61.10 | 64.05 | 66.35 | 69.30 |
| Camarilla | 60.31 | 60.79 | 61.27 | 61.75 | 62.23 | 62.71 | 63.19 |
| Woodie | 53.88 | 56.01 | 59.13 | 61.26 | 64.38 | 66.51 | 69.63 |
| Fibonacci | 55.85 | 57.86 | 59.10 | 61.10 | 63.11 | 64.35 | 66.35 |
Numerical data
The following is the status of the technical indicators and moving averages at the time of publication of this technical analysis:
| RSI (14): | 60.54 | |
| MACD (12,26,9): | 1.2600 | |
| Directional Movement: | 13.24 | |
| AROON (14): | 64.29 | |
| DEMA (21): | 66.78 | |
| Parabolic SAR (0,02-0,02-0,2): | 67.48 | |
| Elder Ray (13): | 0.75 | |
| Super Trend (3,10): | 63.46 | |
| Zig ZAG (10): | 66.00 | |
| VORTEX (21): | 1.1200 | |
| Stochastique (14,3,5): | 73.69 | |
| TEMA (21): | 67.07 | |
| Williams %R (14): | -32.11 | |
| Chande Momentum Oscillator (20): | 1.25 | |
| Repulse (5,40,3): | -3.2800 | |
| ROCnROLL: | 1 | |
| TRIX (15,9): | 0.3100 | |
| Courbe Coppock: | 11.50 |
| MA7: | 66.34 | |
| MA20: | 64.87 | |
| MA50: | 62.44 | |
| MA100: | 60.86 | |
| MAexp7: | 66.15 | |
| MAexp20: | 65.08 | |
| MAexp50: | 63.01 | |
| MAexp100: | 61.24 | |
| Price / MA7: | -0.51% | |
| Price / MA20: | +1.74% | |
| Price / MA50: | +5.70% | |
| Price / MA100: | +8.45% | |
| Price / MAexp7: | -0.23% | |
| Price / MAexp20: | +1.41% | |
| Price / MAexp50: | +4.75% | |
| Price / MAexp100: | +7.77% |
News
The latest news and videos published on COFINIMMO at the time of the analysis were as follows:
About author
Online


Add a comment
Comments
0 comments on the analysis COFINIMMO - Daily