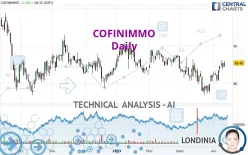
COFINIMMO - Daily - Technical analysis published on 04/14/2023 (GMT)
- 171
- 0
Click here for a new analysis!
- Timeframe : Daily
- - Analysis generated on
- Status : LEVEL MAINTAINED

Summary of the analysis

Additional analysis
Quotes
The COFINIMMO price is 85.45 EUR. The price registered an increase of +1.36% on the session and was between 84.40 EUR and 86.00 EUR. This implies that the price is at +1.24% from its lowest and at -0.64% from its highest.A bullish opening was detected by the Central Gaps scanner. Buyers are trying to impose a bullish momentum in the very short term.
Bullish opening
Type : Bullish
Timeframe : Openning
So that you have an overall view of the price change, here is a table showing the variations over several periods:
Near a new HIGH record (1 month)
Type : Bullish
Timeframe : Weekly
Technical
Technical analysis of this Daily chart of COFINIMMO indicates that the overall trend is not clearly defined. The trend could quickly turn bullish due to the strong bullish signals currently being given by short-term moving averages. The Central Indicators market scanner is currently detecting several bullish signals that could impact this trend:
Bullish price crossover with Moving Average 100
Type : Bullish
Timeframe : Daily
Bullish price crossover with adaptative moving average 100
Type : Bullish
Timeframe : Daily
In fact, according to the parameters integrated into the Central Analyzer system, 14 technical indicators out of 18 analysed are currently bullish. Caution: the Central Indicators scanner currently detects an excess:
CCI indicator is overbought : over 100
Type : Neutral
Timeframe : Daily
Williams %R indicator is overbought : over -20
Type : Neutral
Timeframe : Daily
Pivot points : price is over resistance 1
Type : Neutral
Timeframe : Daily
Pivot points : price is over resistance 1
Type : Neutral
Timeframe : Weekly
SuperTrend indicator bullish reversal
Type : Bullish
Timeframe : Daily
An analysis of the price chart with the Central Patterns scanner (detector of chart patterns and resistances and supports) shows several results that can have an impact on the price change:
Near resistance of channel
Type : Bearish
Timeframe : Daily
Horizontal resistance is broken
Type : Bullish
Timeframe : Daily
No result was found by the Central Candlesticks scanner on Japanese candlesticks.
| S3 | S2 | S1 | Price | R1 | R2 | R3 | |
|---|---|---|---|---|---|---|---|
| ProTrendLines | 65.60 | 78.20 | 84.77 | 85.45 | 91.20 | 94.03 | 105.69 |
| Change (%) | -23.23% | -8.48% | -0.80% | - | +6.73% | +10.04% | +23.69% |
| Change | -19.85 | -7.25 | -0.68 | - | +5.75 | +8.58 | +20.24 |
| Level | Major | Major | Major | - | Intermediate | Major | Major |
Attention could also be paid to pivot points to set price objectives:
| Pivot points | S3 | S2 | S1 | PP | R1 | R2 | R3 |
|---|---|---|---|---|---|---|---|
| Standard | 81.88 | 82.87 | 83.58 | 84.57 | 85.28 | 86.27 | 86.98 |
| Camarilla | 83.83 | 83.99 | 84.14 | 84.30 | 84.46 | 84.61 | 84.77 |
| Woodie | 81.75 | 82.80 | 83.45 | 84.50 | 85.15 | 86.20 | 86.85 |
| Fibonacci | 82.87 | 83.52 | 83.92 | 84.57 | 85.22 | 85.62 | 86.27 |
| Pivot points | S3 | S2 | S1 | PP | R1 | R2 | R3 |
|---|---|---|---|---|---|---|---|
| Standard | 78.50 | 79.50 | 81.50 | 82.50 | 84.50 | 85.50 | 87.50 |
| Camarilla | 82.68 | 82.95 | 83.23 | 83.50 | 83.78 | 84.05 | 84.33 |
| Woodie | 79.00 | 79.75 | 82.00 | 82.75 | 85.00 | 85.75 | 88.00 |
| Fibonacci | 79.50 | 80.65 | 81.35 | 82.50 | 83.65 | 84.35 | 85.50 |
| Pivot points | S3 | S2 | S1 | PP | R1 | R2 | R3 |
|---|---|---|---|---|---|---|---|
| Standard | 66.28 | 71.62 | 76.58 | 81.92 | 86.88 | 92.22 | 97.18 |
| Camarilla | 78.72 | 79.66 | 80.61 | 81.55 | 82.49 | 83.44 | 84.38 |
| Woodie | 66.10 | 71.53 | 76.40 | 81.83 | 86.70 | 92.13 | 97.00 |
| Fibonacci | 71.62 | 75.55 | 77.98 | 81.92 | 85.85 | 88.28 | 92.22 |
Numerical data
The following is the status of the technical indicators and moving averages at the time of publication of this technical analysis:
| RSI (14): | 59.05 | |
| MACD (12,26,9): | 0.3600 | |
| Directional Movement: | 6.39 | |
| AROON (14): | 78.57 | |
| DEMA (21): | 82.84 | |
| Parabolic SAR (0,02-0,02-0,2): | 80.73 | |
| Elder Ray (13): | 2.14 | |
| Super Trend (3,10): | 79.26 | |
| Zig ZAG (10): | 85.40 | |
| VORTEX (21): | 1.0300 | |
| Stochastique (14,3,5): | 85.84 | |
| TEMA (21): | 83.94 | |
| Williams %R (14): | -8.60 | |
| Chande Momentum Oscillator (20): | 6.75 | |
| Repulse (5,40,3): | 1.0700 | |
| ROCnROLL: | 1 | |
| TRIX (15,9): | -0.0800 | |
| Courbe Coppock: | 9.52 |
| MA7: | 83.76 | |
| MA20: | 81.56 | |
| MA50: | 83.97 | |
| MA100: | 84.55 | |
| MAexp7: | 83.94 | |
| MAexp20: | 82.76 | |
| MAexp50: | 83.42 | |
| MAexp100: | 85.44 | |
| Price / MA7: | +2.02% | |
| Price / MA20: | +4.77% | |
| Price / MA50: | +1.76% | |
| Price / MA100: | +1.06% | |
| Price / MAexp7: | +1.80% | |
| Price / MAexp20: | +3.25% | |
| Price / MAexp50: | +2.43% | |
| Price / MAexp100: | +0.01% |
News
The last news published on COFINIMMO at the time of the generation of this analysis was as follows:
About author
Online


Add a comment
Comments
0 comments on the analysis COFINIMMO - Daily