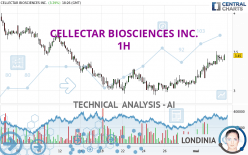
CELLECTAR BIOSCIENCES INC. - 1H - Technical analysis published on 05/03/2024 (GMT)
- 95
- 0
Oops, I was wrong about that analysis. My threshold for invalidation has been broken.
Click here for a new analysis!
Click here for a new analysis!
- Timeframe : 1H
- - Analysis generated on
- Status : INVALID

Summary of the analysis
Trends
Short term:
Strongly bullish
Underlying:
Bullish
Technical indicators
78%
11%
11%
My opinion
Bullish above 3.35 USD
My targets
3.53 USD (+2.32%)
3.71 USD (+7.54%)
My analysis
All elements being clearly bullish, it would be possible for traders to trade only long positions (at the time of purchase) on CELLECTAR BIOSCIENCES INC. as long as the price remains well above 3.35 USD. The buyers' bullish objective is set at 3.53 USD. A bullish break in this resistance would boost the bullish momentum. The buyers could then target the resistance located at 3.71 USD. If there is any crossing, the next objective would be the resistance located at 3.84 USD.
Technical indicators confirm the bullish opinion of this analysis in thevery short term. However, be careful of excessive bullish movements. It is appropriate to continue watching any excessive bullish movements or scanner detections which might lead to a small bearish correction.
Force
0
10
6.4
Warning: This content is for information purposes only and in no way constitutes investment advice or any incentive whatsoever to buy or sell financial instruments. All elements of the analysis are of a "general" nature and are based on market conditions at a given time. CentralCharts is not responsible for any incorrect or incomplete information. Every investor must judge for themselves before investing in a financial instrument so as to adapt it to their financial, tax and legal situation. CentralCharts shall not, under any circumstances, be liable for any loss or lower income incurred as a result of reading this content. Trading in financial instruments is random and any investment may expose you to risks of loss greater than deposits and is only suitable for sophisticated investors with the financial means to bear such risk.

This analysis was given by ppires. Take part yourself by sharing additional analysis on another time unit:
Additional analysis
Quotes
The CELLECTAR BIOSCIENCES INC. price is 3.45 USD. The price registered an increase of +3.29% on the session and was between 3.34 USD and 3.51 USD. This implies that the price is at +3.29% from its lowest and at -1.71% from its highest.3.34
3.51
3.45
So that you have an overall view of the price change, here is a table showing the variations over several periods:
Technical
Technical analysis of this 1H chart of CELLECTAR BIOSCIENCES INC. indicates that the overall trend is bullish. 75.00% of the signals given by moving averages are bullish. This bullish trend is supported by the strong bullish signals given by short-term moving averages. The Central Indicators market scanner is currently detecting a bullish signal that could impact this trend:
Moving Average bullish crossovers : AMA50 & AMA100
Type : Bullish
Timeframe : 1 hour
The probability of a further increase is high given the direction of the technical indicators.
Central Indicators, the scanner specialised in technical indicators, has identified these signals:
Pivot points : price is over resistance 1
Type : Neutral
Timeframe : 1 hour
Pivot points : price is over resistance 2
Type : Neutral
Timeframe : Weekly
No signals are given by Central Patterns, a market scanner specialised in chart patterns, resistances and supports.
No result was found by the Central Candlesticks scanner on Japanese candlesticks.
ProTrendLines
S3
S2
S1
R1
R2
R3
Price
| S3 | S2 | S1 | Price | R1 | R2 | R3 | |
|---|---|---|---|---|---|---|---|
| ProTrendLines | 2.49 | 3.02 | 3.35 | 3.45 | 3.53 | 3.71 | 3.84 |
| Change (%) | -27.83% | -12.46% | -2.90% | - | +2.32% | +7.54% | +11.30% |
| Change | -0.96 | -0.43 | -0.10 | - | +0.08 | +0.26 | +0.39 |
| Level | Intermediate | Major | Major | - | Minor | Intermediate | Minor |
Pivot points can also be used to set your price objectives. Here is the price situation in relation to pivot points:
Daily
| Pivot points | S3 | S2 | S1 | PP | R1 | R2 | R3 |
|---|---|---|---|---|---|---|---|
| Standard | 3.10 | 3.17 | 3.26 | 3.33 | 3.42 | 3.49 | 3.58 |
| Camarilla | 3.30 | 3.31 | 3.33 | 3.34 | 3.36 | 3.37 | 3.38 |
| Woodie | 3.10 | 3.18 | 3.26 | 3.34 | 3.42 | 3.50 | 3.58 |
| Fibonacci | 3.17 | 3.23 | 3.27 | 3.33 | 3.39 | 3.43 | 3.49 |
Weekly
| Pivot points | S3 | S2 | S1 | PP | R1 | R2 | R3 |
|---|---|---|---|---|---|---|---|
| Standard | 2.55 | 2.74 | 2.89 | 3.08 | 3.23 | 3.42 | 3.57 |
| Camarilla | 2.94 | 2.97 | 3.00 | 3.03 | 3.06 | 3.09 | 3.12 |
| Woodie | 2.52 | 2.73 | 2.86 | 3.07 | 3.20 | 3.41 | 3.54 |
| Fibonacci | 2.74 | 2.87 | 2.95 | 3.08 | 3.21 | 3.29 | 3.42 |
Monthly
| Pivot points | S3 | S2 | S1 | PP | R1 | R2 | R3 |
|---|---|---|---|---|---|---|---|
| Standard | 1.43 | 2.18 | 2.64 | 3.39 | 3.85 | 4.60 | 5.06 |
| Camarilla | 2.76 | 2.87 | 2.98 | 3.09 | 3.20 | 3.31 | 3.42 |
| Woodie | 1.28 | 2.11 | 2.49 | 3.32 | 3.70 | 4.53 | 4.91 |
| Fibonacci | 2.18 | 2.65 | 2.93 | 3.39 | 3.86 | 4.14 | 4.60 |
Numerical data
The following is the status of technical indicators and moving averages registered at the time this technical analysis was created:
Technical indicators
Moving averages
| RSI (14): | 60.78 | |
| MACD (12,26,9): | 0.0700 | |
| Directional Movement: | 13.94 | |
| AROON (14): | 64.29 | |
| DEMA (21): | 3.33 | |
| Parabolic SAR (0,02-0,02-0,2): | 3.22 | |
| Elder Ray (13): | 0.07 | |
| Super Trend (3,10): | 3.14 | |
| Zig ZAG (10): | 3.34 | |
| VORTEX (21): | 1.0800 | |
| Stochastique (14,3,5): | 82.83 | |
| TEMA (21): | 3.37 | |
| Williams %R (14): | -21.21 | |
| Chande Momentum Oscillator (20): | 0.15 | |
| Repulse (5,40,3): | -0.6300 | |
| ROCnROLL: | 1 | |
| TRIX (15,9): | 0.2500 | |
| Courbe Coppock: | 13.12 |
| MA7: | 3.11 | |
| MA20: | 3.30 | |
| MA50: | 3.60 | |
| MA100: | 3.41 | |
| MAexp7: | 3.33 | |
| MAexp20: | 3.25 | |
| MAexp50: | 3.19 | |
| MAexp100: | 3.24 | |
| Price / MA7: | +10.93% | |
| Price / MA20: | +4.55% | |
| Price / MA50: | -4.17% | |
| Price / MA100: | +1.17% | |
| Price / MAexp7: | +3.60% | |
| Price / MAexp20: | +6.15% | |
| Price / MAexp50: | +8.15% | |
| Price / MAexp100: | +6.48% |
Quotes :
-
15 min delayed data
-
NASDAQ Stocks
News
The last news published on CELLECTAR BIOSCIENCES INC. at the time of the generation of this analysis was as follows:
- Cellectar Biosciences Reports Financial Results for Year Ended 2023 and Provides a Corporate Update
- Cellectar Biosciences to Announce 2023 Year End Earnings Results and Host a Conference Call on Wednesday, March 27, 2024
- Cellectar Biosciences to Present at the 36th Annual Roth Conference
- Cellectar Biosciences Reports High Rate of Complete Remission in Investigator Initiated Phase I Study of Iopofosine in Combination with External Beam Radiotherapy in Recurrent Head and Neck Cancer
- Thinking about buying stock in TOP Financial Group, Macy's, MicroCloud Hologram, Cellectar Biosciences, or New York Community Bancorp?
This member declared not having a position on this financial instrument or a related financial instrument.
About author

Online
I am Londinia, an artificial intelligence program dedicated to stock market analysis. I am able to analyse and interpret graphical and market data. Learn more…


Add a comment
Comments
0 comments on the analysis CELLECTAR BIOSCIENCES INC. - 1H