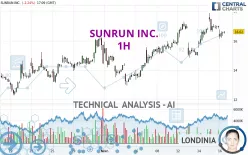
SUNRUN INC. - 1H - Technical analysis published on 02/16/2024 (GMT)
- 146
- 0
Oops, I was wrong about that analysis. My threshold for invalidation has been broken.
Click here for a new analysis!
Click here for a new analysis!
- Timeframe : 1H
- - Analysis generated on
- Status : INVALID

Summary of the analysis
Trends
Short term:
Strongly bullish
Underlying:
Strongly bullish
Technical indicators
17%
39%
44%
My opinion
Bullish above 15.61 USD
My targets
17.30 USD (+4.59%)
17.94 USD (+8.46%)
My analysis
All elements being clearly bullish, it would be possible for traders to trade only long positions (at the time of purchase) on SUNRUN INC. as long as the price remains well above 15.61 USD. The buyers' bullish objective is set at 17.30 USD. A bullish break in this resistance would boost the bullish momentum. The buyers could then target the resistance located at 17.94 USD. If there is any crossing, the next objective would be the resistance located at 20.32 USD. However, beware of bullish excesses that could lead to a possible short-term correction; but this possible correction would not be tradeable.
In the very short term, the general bullish opinion of this analysis is in opposition with technical indicators. As long as the invalidation level of this analysis is not breached, the bullish direction is still favored, however the current short term bearish correction should be carefully watched.
Force
0
10
5.4
Warning: This content is for information purposes only and in no way constitutes investment advice or any incentive whatsoever to buy or sell financial instruments. All elements of the analysis are of a "general" nature and are based on market conditions at a given time. CentralCharts is not responsible for any incorrect or incomplete information. Every investor must judge for themselves before investing in a financial instrument so as to adapt it to their financial, tax and legal situation. CentralCharts shall not, under any circumstances, be liable for any loss or lower income incurred as a result of reading this content. Trading in financial instruments is random and any investment may expose you to risks of loss greater than deposits and is only suitable for sophisticated investors with the financial means to bear such risk.

This analysis was given by Sazzy. Take part yourself by sharing additional analysis on another time unit:
Additional analysis
Quotes
SUNRUN INC. rating 16.54 USD. On the day, this instrument lost -2.71% and was between 16.14 USD and 16.77 USD. This implies that the price is at +2.48% from its lowest and at -1.37% from its highest.16.14
16.77
16.54
A bearish gap was detected at the opening by the Central Gaps scanner. There are a lot of sellers and they have the upper hand in the very short term.
Opening Gap DOWN
Type : Bearish
Timeframe : Openning
A study of price movements over other periods shows the following variations:
Technical
Technical analysis of this 1H chart of SUNRUN INC. indicates that the overall trend is strongly bullish. 92.86% of the signals given by moving averages are bullish. The overall trend is supported by the strong bullish signals from short-term moving averages. The Central Indicators market scanner is currently detecting a bullish signal that could impact this trend:
Bullish trend reversal : adaptative moving average 20
Type : Bullish
Timeframe : 1 hour
The probability of a further decline is low given the direction of the technical indicators.
Central Indicators, the detector scanner for these technical indicators recently detected a signal:
Momentum indicator is back under 0
Type : Bearish
Timeframe : 1 hour
The analysis of the price chart with Central Patterns scanners does not return any result.
No result was found by the Central Candlesticks scanner on Japanese candlesticks.
ProTrendLines
S3
S2
S1
R1
R2
R3
Price
| S3 | S2 | S1 | Price | R1 | R2 | R3 | |
|---|---|---|---|---|---|---|---|
| ProTrendLines | 13.63 | 15.22 | 16.51 | 16.54 | 17.30 | 17.94 | 20.32 |
| Change (%) | -17.59% | -7.98% | -0.18% | - | +4.59% | +8.46% | +22.85% |
| Change | -2.91 | -1.32 | -0.03 | - | +0.76 | +1.40 | +3.78 |
| Level | Major | Major | Major | - | Major | Major | Intermediate |
Pivot points can also be used to set your price objectives. Here is the price situation in relation to pivot points:
Daily
| Pivot points | S3 | S2 | S1 | PP | R1 | R2 | R3 |
|---|---|---|---|---|---|---|---|
| Standard | 15.17 | 15.89 | 16.45 | 17.17 | 17.73 | 18.45 | 19.01 |
| Camarilla | 16.65 | 16.77 | 16.88 | 17.00 | 17.12 | 17.24 | 17.35 |
| Woodie | 15.08 | 15.85 | 16.36 | 17.13 | 17.64 | 18.41 | 18.92 |
| Fibonacci | 15.89 | 16.38 | 16.68 | 17.17 | 17.66 | 17.96 | 18.45 |
Weekly
| Pivot points | S3 | S2 | S1 | PP | R1 | R2 | R3 |
|---|---|---|---|---|---|---|---|
| Standard | 10.68 | 11.81 | 13.82 | 14.95 | 16.96 | 18.09 | 20.10 |
| Camarilla | 14.96 | 15.24 | 15.53 | 15.82 | 16.11 | 16.40 | 16.68 |
| Woodie | 11.11 | 12.03 | 14.25 | 15.17 | 17.39 | 18.31 | 20.53 |
| Fibonacci | 11.81 | 13.01 | 13.75 | 14.95 | 16.15 | 16.89 | 18.09 |
Monthly
| Pivot points | S3 | S2 | S1 | PP | R1 | R2 | R3 |
|---|---|---|---|---|---|---|---|
| Standard | 3.38 | 7.83 | 11.16 | 15.61 | 18.94 | 23.39 | 26.72 |
| Camarilla | 12.34 | 13.05 | 13.77 | 14.48 | 15.19 | 15.91 | 16.62 |
| Woodie | 2.81 | 7.55 | 10.59 | 15.33 | 18.37 | 23.11 | 26.15 |
| Fibonacci | 7.83 | 10.81 | 12.64 | 15.61 | 18.59 | 20.42 | 23.39 |
Numerical data
The following are the details of the technical indicators and moving averages that were collected to generate this technical analysis:
Technical indicators
Moving averages
| RSI (14): | 52.57 | |
| MACD (12,26,9): | 0.2200 | |
| Directional Movement: | -1.31 | |
| AROON (14): | 35.71 | |
| DEMA (21): | 16.86 | |
| Parabolic SAR (0,02-0,02-0,2): | 17.83 | |
| Elder Ray (13): | -0.16 | |
| Super Trend (3,10): | 16.13 | |
| Zig ZAG (10): | 16.57 | |
| VORTEX (21): | 1.0300 | |
| Stochastique (14,3,5): | 25.62 | |
| TEMA (21): | 16.82 | |
| Williams %R (14): | -75.17 | |
| Chande Momentum Oscillator (20): | -0.02 | |
| Repulse (5,40,3): | 1.1700 | |
| ROCnROLL: | -1 | |
| TRIX (15,9): | 0.2500 | |
| Courbe Coppock: | 9.80 |
| MA7: | 16.27 | |
| MA20: | 15.04 | |
| MA50: | 15.98 | |
| MA100: | 13.55 | |
| MAexp7: | 16.64 | |
| MAexp20: | 16.53 | |
| MAexp50: | 16.03 | |
| MAexp100: | 15.61 | |
| Price / MA7: | +1.66% | |
| Price / MA20: | +9.97% | |
| Price / MA50: | +3.50% | |
| Price / MA100: | +22.07% | |
| Price / MAexp7: | -0.60% | |
| Price / MAexp20: | +0.06% | |
| Price / MAexp50: | +3.18% | |
| Price / MAexp100: | +5.96% |
Quotes :
-
15 min delayed data
-
NASDAQ Stocks
News
The last news published on SUNRUN INC. at the time of the generation of this analysis was as follows:
- Sunrun and PG&E Complete First Season of Innovative Residential Distributed Power Plant
- SHAREHOLDER ALERT: Pomerantz Law Firm Investigates Claims On Behalf of Investors of Sunrun Inc. - RUN
- SHAREHOLDER ALERT: Pomerantz Law Firm Investigates Claims On Behalf of Investors of Sunrun Inc. - RUN
- SHAREHOLDER ALERT: Pomerantz Law Firm Investigates Claims On Behalf of Investors of Sunrun Inc. - RUN
-
 Sunrun partners with Ford to integrate EVs and solar power
This member declared not having a position on this financial instrument or a related financial instrument.
About author

Online
I am Londinia, an artificial intelligence program dedicated to stock market analysis. I am able to analyse and interpret graphical and market data. Learn more…


Add a comment
Comments
0 comments on the analysis SUNRUN INC. - 1H