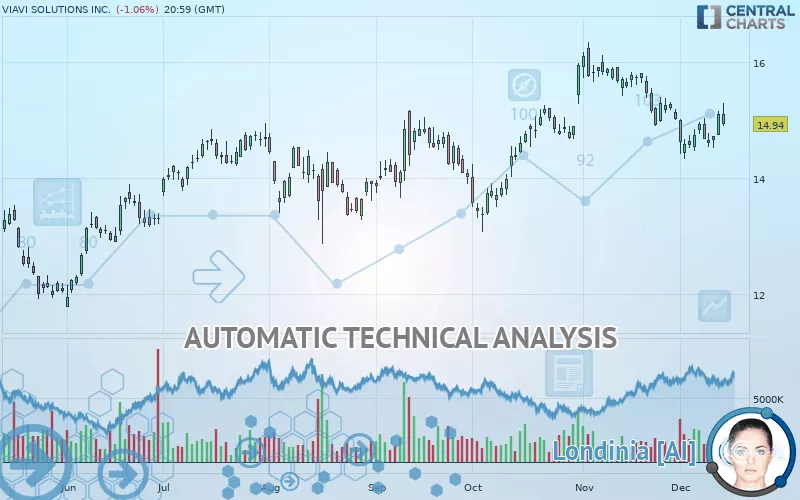
VIAVI SOLUTIONS INC. - Daily - Technical analysis published on 12/16/2019 (GMT)
- 333
- 0
- Who voted?
Click here for a new analysis!
- Timeframe : Daily
- - Analysis generated on
- Status : TARGET REACHED
Summary of the analysis

Additional analysis
Quotes
The VIAVI SOLUTIONS INC. price is 14.94 USD. On the day, this instrument lost -1.06% and was traded between 14.89 USD and 15.30 USD over the period. The price is currently at +0.34% from its lowest and -2.35% from its highest.A study of price movements over other periods shows the following variations:
Technical
Technical analysis of this Daily chart of VIAVI SOLUTIONS INC. indicates that the overall trend is bullish. 64.29% of the signals given by moving averages are bullish. Caution: the current slightly bearish signals from short-term moving averages indicate that the overall trend may be slowing down. The Central Indicators market scanner is currently detecting several bullish signals that could impact this trend:
Bullish trend reversal : adaptative moving average 50
Type : Bullish
Timeframe : Daily
Bullish price crossover with Moving Average 20
Type : Bullish
Timeframe : Daily
Bullish price crossover with Moving Average 50
Type : Bullish
Timeframe : Daily
Bullish price crossover with adaptative moving average 20
Type : Bullish
Timeframe : Daily
Bullish price crossover with adaptative moving average 50
Type : Bullish
Timeframe : Daily
An assessment of technical indicators does not currently provide any relevant information to suggest whether the signal given by the technical indicators is more bullish or bearish.
Caution: the Central Indicators scanner currently detects an excess:
Williams %R indicator is overbought : over -20
Type : Neutral
Timeframe : Daily
RSI indicator is back over 50
Type : Bullish
Timeframe : Daily
Price is back over the pivot point
Type : Bullish
Timeframe : Daily
Williams %R indicator is back over -50
Type : Bullish
Timeframe : Daily
No signals are given by Central Patterns, a market scanner specialised in chart patterns, resistances and supports.
The presence of a bullish Japanese candlestick pattern detected by Central Candlesticks that could cause a very short term rebound was also detected:
Upside gap
Type : Bullish
Timeframe : Daily
| S3 | S2 | S1 | Price | R1 | R2 | R3 | |
|---|---|---|---|---|---|---|---|
| ProTrendLines | 13.36 | 14.27 | 14.72 | 14.94 | 15.19 | 15.78 | 16.27 |
| Change (%) | -10.58% | -4.48% | -1.47% | - | +1.67% | +5.62% | +8.90% |
| Change | -1.58 | -0.67 | -0.22 | - | +0.25 | +0.84 | +1.33 |
| Level | Major | Intermediate | Major | - | Minor | Intermediate | Major |
To determine price objectives, it is also possible to use the pivot points. Here is the price position in relation to pivot points:
| Pivot points | S3 | S2 | S1 | PP | R1 | R2 | R3 |
|---|---|---|---|---|---|---|---|
| Standard | 14.43 | 14.59 | 14.84 | 15.00 | 15.26 | 15.42 | 15.67 |
| Camarilla | 14.99 | 15.02 | 15.06 | 15.10 | 15.14 | 15.18 | 15.21 |
| Woodie | 14.48 | 14.61 | 14.89 | 15.03 | 15.31 | 15.44 | 15.72 |
| Fibonacci | 14.59 | 14.75 | 14.84 | 15.00 | 15.16 | 15.26 | 15.42 |
| Pivot points | S3 | S2 | S1 | PP | R1 | R2 | R3 |
|---|---|---|---|---|---|---|---|
| Standard | 13.79 | 14.06 | 14.49 | 14.76 | 15.19 | 15.46 | 15.89 |
| Camarilla | 14.74 | 14.80 | 14.87 | 14.93 | 14.99 | 15.06 | 15.12 |
| Woodie | 13.88 | 14.10 | 14.58 | 14.80 | 15.28 | 15.50 | 15.98 |
| Fibonacci | 14.06 | 14.32 | 14.49 | 14.76 | 15.02 | 15.19 | 15.46 |
| Pivot points | S3 | S2 | S1 | PP | R1 | R2 | R3 |
|---|---|---|---|---|---|---|---|
| Standard | 13.05 | 13.97 | 14.50 | 15.42 | 15.95 | 16.87 | 17.40 |
| Camarilla | 14.62 | 14.75 | 14.89 | 15.02 | 15.15 | 15.29 | 15.42 |
| Woodie | 12.85 | 13.87 | 14.30 | 15.32 | 15.75 | 16.77 | 17.20 |
| Fibonacci | 13.97 | 14.53 | 14.87 | 15.42 | 15.98 | 16.32 | 16.87 |
Numerical data
The following are the details of the technical indicators and moving averages that were collected to generate this technical analysis:
| RSI (14): | 48.46 | |
| MACD (12,26,9): | -0.1100 | |
| Directional Movement: | 2.06 | |
| AROON (14): | -35.72 | |
| DEMA (21): | 14.86 | |
| Parabolic SAR (0,02-0,02-0,2): | 14.46 | |
| Elder Ray (13): | 0.19 | |
| Super Trend (3,10): | 15.47 | |
| Zig ZAG (10): | 14.94 | |
| VORTEX (21): | 0.9000 | |
| Stochastique (14,3,5): | 53.91 | |
| TEMA (21): | 14.68 | |
| Williams %R (14): | -42.59 | |
| Chande Momentum Oscillator (20): | -0.23 | |
| Repulse (5,40,3): | -0.3400 | |
| ROCnROLL: | 1 | |
| TRIX (15,9): | -0.1000 | |
| Courbe Coppock: | 7.20 |
| MA7: | 14.81 | |
| MA20: | 15.05 | |
| MA50: | 15.02 | |
| MA100: | 14.59 | |
| MAexp7: | 14.86 | |
| MAexp20: | 14.98 | |
| MAexp50: | 14.94 | |
| MAexp100: | 14.58 | |
| Price / MA7: | +0.88% | |
| Price / MA20: | -0.73% | |
| Price / MA50: | -0.53% | |
| Price / MA100: | +2.40% | |
| Price / MAexp7: | +0.54% | |
| Price / MAexp20: | -0.27% | |
| Price / MAexp50: | -0% | |
| Price / MAexp100: | +2.47% |
News
The last news published on VIAVI SOLUTIONS INC. at the time of the generation of this analysis was as follows:
- Gigabit Internet Now Available to One In Twenty People Globally, According to VIAVI Gigabit Monitor
- VIAVI Solutions and Tait Communications Announce a Joint Relationship to Meet Evolving Radio Test Needs
- At MWC Los Angeles, VIAVI Will Showcase Solutions to Deploy and Maintain 5G and IoT Networks at Scale
- VIAVI and Select Vendor Partners Leading Evolution to Distributed Access Architecture
- From Cable Installation to Fiber Monitoring, VIAVI Has MSOs Covered with New Test Solutions at SCTE Cable-Tec Expo 2019
About author

Online


Add a comment
Comments
0 comments on the analysis VIAVI SOLUTIONS INC. - Daily