COCA-COLA CO. - Daily - Technical analysis published on 03/19/2024 (GMT)
- 162
- 0
Click here for a new analysis!
- Timeframe : Daily
- - Analysis generated on
- Status : INVALID
Summary of the analysis

Additional analysis
Quotes
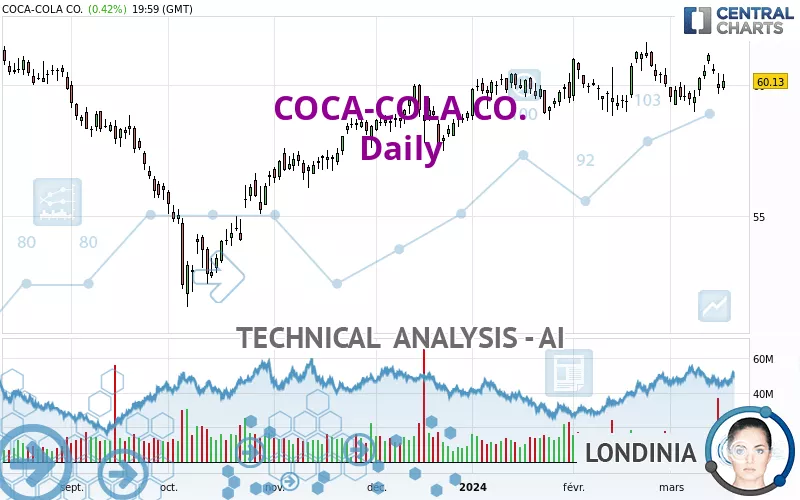
The COCA-COLA CO. price is 60.13 USD. On the day, this instrument gained +0.42% and was traded between 59.80 USD and 60.40 USD over the period. The price is currently at +0.55% from its lowest and -0.45% from its highest.The Central Gaps scanner detects a bullish opening. A small advantage for buyers in the very short term.
Bullish opening
Type : Bullish
Timeframe : Openning
A study of price movements over other periods shows the following variations:
Near a new LOW record (1st january)
Type : Bearish
Timeframe : Weekly
Near a new LOW record (1 month)
Type : Bearish
Timeframe : Weekly
Technical
Technical analysis of COCA-COLA CO. in Daily shows a strongly overall bullish trend. 92.86% of the signals given by moving averages are bullish. This strongly bullish trend is supported by the strong bullish signals given by short-term moving averages. The Central Indicators scanner does not detect any result on moving averages that would impact this trend.
The technical indicators are bullish. There is still some doubt about the price increase.
Other results related to technical indicators were also found by the Central Indicators scanner:
Price is back over the pivot point
Type : Bullish
Timeframe : Daily
Price is back over the pivot point
Type : Bullish
Timeframe : Weekly
Momentum indicator is back over 0
Type : Bullish
Timeframe : Daily
An analysis of the price chart with the Central Patterns scanner (detector of chart patterns and resistances and supports) shows a result that can have an impact on the price change:
Near resistance of triangle
Type : Bearish
Timeframe : Daily
The Central Candlesticks scanner, specialised in Japanese candlesticks, did not identify any signals.
| S3 | S2 | S1 | Price | R1 | R2 | R3 | |
|---|---|---|---|---|---|---|---|
| ProTrendLines | 57.91 | 58.84 | 59.91 | 60.13 | 60.75 | 61.56 | 62.79 |
| Change (%) | -3.69% | -2.15% | -0.37% | - | +1.03% | +2.38% | +4.42% |
| Change | -2.22 | -1.29 | -0.22 | - | +0.62 | +1.43 | +2.66 |
| Level | Intermediate | Intermediate | Minor | - | Major | Intermediate | Major |
To determine price objectives, it is also possible to use the pivot points. Here is the price position in relation to pivot points:
| Pivot points | S3 | S2 | S1 | PP | R1 | R2 | R3 |
|---|---|---|---|---|---|---|---|
| Standard | 59.22 | 59.51 | 59.82 | 60.11 | 60.42 | 60.71 | 61.02 |
| Camarilla | 59.97 | 60.02 | 60.08 | 60.13 | 60.19 | 60.24 | 60.30 |
| Woodie | 59.23 | 59.52 | 59.83 | 60.12 | 60.43 | 60.72 | 61.03 |
| Fibonacci | 59.51 | 59.74 | 59.88 | 60.11 | 60.34 | 60.48 | 60.71 |
| Pivot points | S3 | S2 | S1 | PP | R1 | R2 | R3 |
|---|---|---|---|---|---|---|---|
| Standard | 55.39 | 56.85 | 58.20 | 59.66 | 61.01 | 62.47 | 63.82 |
| Camarilla | 58.77 | 59.03 | 59.28 | 59.54 | 59.80 | 60.06 | 60.31 |
| Woodie | 55.33 | 56.82 | 58.14 | 59.63 | 60.95 | 62.44 | 63.76 |
| Fibonacci | 56.85 | 57.93 | 58.59 | 59.66 | 60.74 | 61.40 | 62.47 |
Numerical data
The following are the details of the technical indicators and moving averages that were collected to generate this technical analysis:
| RSI (14): | 55.30 | |
| MACD (12,26,9): | 0.1800 | |
| Directional Movement: | 0.57 | |
| AROON (14): | 28.57 | |
| DEMA (21): | 59.97 | |
| Parabolic SAR (0,02-0,02-0,2): | 58.72 | |
| Elder Ray (13): | 0.25 | |
| Super Trend (3,10): | 58.63 | |
| Zig ZAG (10): | 60.13 | |
| VORTEX (21): | 1.0300 | |
| Stochastique (14,3,5): | 72.61 | |
| TEMA (21): | 59.99 | |
| Williams %R (14): | -29.13 | |
| Chande Momentum Oscillator (20): | 0.59 | |
| Repulse (5,40,3): | 0.2000 | |
| ROCnROLL: | 1 | |
| TRIX (15,9): | 0.0200 | |
| Courbe Coppock: | 0.09 |
| MA7: | 59.99 | |
| MA20: | 59.86 | |
| MA50: | 59.54 | |
| MA100: | 58.38 | |
| MAexp7: | 59.99 | |
| MAexp20: | 59.76 | |
| MAexp50: | 59.36 | |
| MAexp100: | 58.80 | |
| Price / MA7: | +0.23% | |
| Price / MA20: | +0.45% | |
| Price / MA50: | +0.99% | |
| Price / MA100: | +3.00% | |
| Price / MAexp7: | +0.23% | |
| Price / MAexp20: | +0.62% | |
| Price / MAexp50: | +1.30% | |
| Price / MAexp100: | +2.26% |
News
The last news published on COCA-COLA CO. at the time of the generation of this analysis was as follows:
-
 Look ahead 13/02/24: US CPI; UK unemployment; Coca-Cola and TUI earnings
-
Week ahead: Retail; consumer confidence; Coca-Cola; Cisco; Commerzbank; NatWest
- Hillenbrand, The Coca-Cola Company, and Net Impact Announce Second-annual Plastic Case Competition to Drive Circularity
- Coca-Cola Singapore partners XSQUARE to launch new Autonomous Forklifts and Warehouse Orchestration System
- Penny Pops: Wendy's Fans Can Pay a Penny and Fill Their Cup with a Coca-Cola Freestyle® Drink Daily Starting Dec. 13
About author

Online


Add a comment
Comments
0 comments on the analysis COCA-COLA CO. - Daily