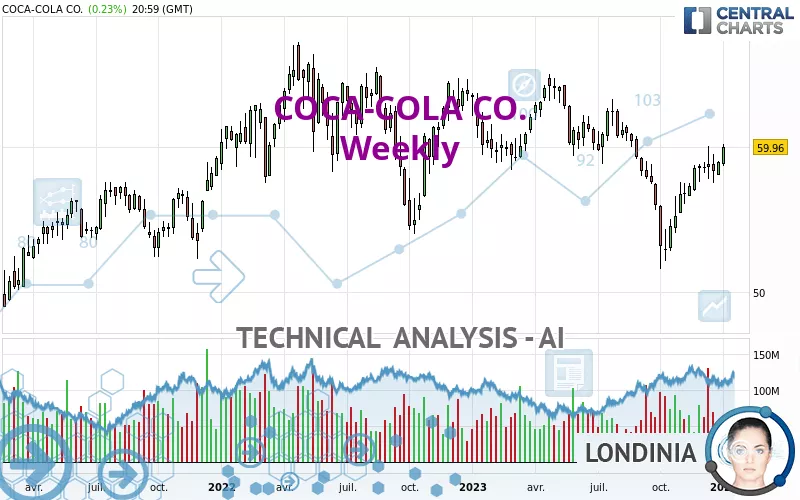
COCA-COLA CO. - Weekly - Technical analysis published on 01/04/2024 (GMT)
- 182
- 0
Click here for a new analysis!
- Timeframe : Weekly
- - Analysis generated on
- Status : TARGET REACHED
Summary of the analysis

Additional analysis
Quotes
The COCA-COLA CO. price is 59.96 USD. The price is up +2.06% over 5 days and was traded between 58.67 USD and 60.20 USD over the period. The price is currently at +2.20% from its lowest point and -0.40% from its highest point.The Central Gaps scanner detects a bullish gap which is a sign that buyers have taken the lead in the very short term.
Opening Gap UP
Type : Bullish
Timeframe : Openning
A study of price movements over other periods shows the following variations:
Near a new LOW record (1st january)
Type : Bearish
Timeframe : Weekly
New HIGH record (1 month)
Type : Bullish
Timeframe : Weekly
Technical
Technical analysis of COCA-COLA CO. in Weekly shows an overall bullish trend. 75.00% of the signals given by moving averages are bullish. The overall trend seems to be showing some signs of weakness, as do the tentative bullish signals given by short-term moving averages. An assessment of moving averages reveals several bullish signals that could impact this trend:
Bullish price crossover with Moving Average 50
Type : Bullish
Timeframe : Weekly
Bullish price crossover with Moving Average 100
Type : Bullish
Timeframe : Weekly
Technical indicators are strongly bullish, suggesting that the price increase should continue.
Caution: the Central Indicators scanner currently detects an excess:
CCI indicator is overbought : over 100
Type : Neutral
Timeframe : Weekly
Williams %R indicator is overbought : over -20
Type : Neutral
Timeframe : Weekly
Pivot points : price is over resistance 2
Type : Neutral
Timeframe : Weekly
MACD indicator is back over 0
Type : Bullish
Timeframe : Weekly
Central Patterns, the market scanner focusing on chart patterns, resistances and supports found these results:
Near horizontal resistance
Type : Bearish
Timeframe : Weekly
Resistance of channel is broken
Type : Bullish
Timeframe : Weekly
No result was found by the Central Candlesticks scanner on Japanese candlesticks.
| S3 | S2 | S1 | Price | R1 | R2 | |
|---|---|---|---|---|---|---|
| ProTrendLines | 49.48 | 52.75 | 57.47 | 59.96 | 60.88 | 63.26 |
| Change (%) | -17.48% | -12.02% | -4.15% | - | +1.53% | +5.50% |
| Change | -10.48 | -7.21 | -2.49 | - | +0.92 | +3.30 |
| Level | Minor | Major | Intermediate | - | Intermediate | Major |
Pivot points can also be used to set your price objectives. Here is the price situation in relation to pivot points:
| Pivot points | S3 | S2 | S1 | PP | R1 | R2 | R3 |
|---|---|---|---|---|---|---|---|
| Standard | 59.31 | 59.53 | 59.75 | 59.97 | 60.19 | 60.41 | 60.63 |
| Camarilla | 59.84 | 59.88 | 59.92 | 59.96 | 60.00 | 60.04 | 60.08 |
| Woodie | 59.30 | 59.53 | 59.74 | 59.97 | 60.18 | 60.41 | 60.62 |
| Fibonacci | 59.53 | 59.70 | 59.81 | 59.97 | 60.14 | 60.25 | 60.41 |
| Pivot points | S3 | S2 | S1 | PP | R1 | R2 | R3 |
|---|---|---|---|---|---|---|---|
| Standard | 57.49 | 58.08 | 59.02 | 59.61 | 60.55 | 61.14 | 62.08 |
| Camarilla | 59.54 | 59.68 | 59.82 | 59.96 | 60.10 | 60.24 | 60.38 |
| Woodie | 57.67 | 58.17 | 59.20 | 59.70 | 60.73 | 61.23 | 62.26 |
| Fibonacci | 58.08 | 58.66 | 59.03 | 59.61 | 60.19 | 60.56 | 61.14 |
| Pivot points | S3 | S2 | S1 | PP | R1 | R2 | R3 |
|---|---|---|---|---|---|---|---|
| Standard | 55.02 | 56.24 | 57.59 | 58.81 | 60.16 | 61.38 | 62.73 |
| Camarilla | 58.22 | 58.46 | 58.69 | 58.93 | 59.17 | 59.40 | 59.64 |
| Woodie | 55.08 | 56.27 | 57.65 | 58.84 | 60.22 | 61.41 | 62.79 |
| Fibonacci | 56.24 | 57.23 | 57.83 | 58.81 | 59.80 | 60.40 | 61.38 |
Numerical data
The following are the details of the technical indicators and moving averages that were collected to generate this technical analysis:
| RSI (14): | 59.80 | |
| MACD (12,26,9): | 0.0300 | |
| Directional Movement: | 6.70 | |
| AROON (14): | 92.86 | |
| DEMA (21): | 57.69 | |
| Parabolic SAR (0,02-0,02-0,2): | 53.80 | |
| Elder Ray (13): | 1.42 | |
| Super Trend (3,10): | 54.49 | |
| Zig ZAG (10): | 59.96 | |
| VORTEX (21): | 0.9600 | |
| Stochastique (14,3,5): | 88.52 | |
| TEMA (21): | 58.25 | |
| Williams %R (14): | -2.65 | |
| Chande Momentum Oscillator (20): | 7.49 | |
| Repulse (5,40,3): | 3.6800 | |
| ROCnROLL: | 1 | |
| TRIX (15,9): | -0.1500 | |
| Courbe Coppock: | 7.75 |
| MA7: | 59.01 | |
| MA20: | 58.86 | |
| MA50: | 57.57 | |
| MA100: | 57.17 | |
| MAexp7: | 58.58 | |
| MAexp20: | 57.94 | |
| MAexp50: | 58.39 | |
| MAexp100: | 57.68 | |
| Price / MA7: | +1.61% | |
| Price / MA20: | +1.87% | |
| Price / MA50: | +4.15% | |
| Price / MA100: | +4.88% | |
| Price / MAexp7: | +2.36% | |
| Price / MAexp20: | +3.49% | |
| Price / MAexp50: | +2.69% | |
| Price / MAexp100: | +3.95% |
News
Don't forget to follow the news on COCA-COLA CO.. At the time of publication of this analysis, the latest news was as follows:
- Penny Pops: Wendy's Fans Can Pay a Penny and Fill Their Cup with a Coca-Cola Freestyle® Drink Daily Starting Dec. 13
- Coca-Cola Europacific Partners Selects MRI Software to Simplify Multi-Regional and Multi-Language Lease Management
- Pioneers Behind Web3 Campaigns of Coca-Cola, Under Armour and Others Launch Next-Generation Loyalty Initiative
- Coca-Cola & Beloved Local U.S. Pizzerias Are Offering Up Their Iconic Pizza In Exchange For Recycling A Bottle
- COCA-COLA, RECKITT, CIGNA HEALTHCARE, PEPSICO, DIAGEO, DFI RETAIL GROUP, FINE HYGIENIC HOLDING TO HEADLINE 2023 WORLD EDITION OF BREAK THE CEILING TOUCH THE SKY®
About author

Online


Add a comment
Comments
0 comments on the analysis COCA-COLA CO. - Weekly