| Open: | - |
| Change: | - |
| Volume: | - |
| Low: | - |
| High: | - |
| High / Low range: | - |
| Type: | Stocks |
| Ticker: | KO |
| ISIN: |
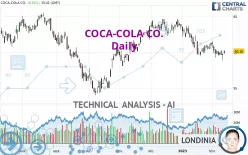
COCA-COLA CO. - Daily - Technical analysis published on 02/13/2023 (GMT)
- 223
- 0
- 02/13/2023 - 15:57
Click here for a new analysis!
- Timeframe : Daily
- - Analysis generated on 02/13/2023 - 15:57
- Status : LEVEL MAINTAINED

Summary of the analysis

Additional analysis
Quotes
The COCA-COLA CO. price is 60.17 USD. The price has increased by +0.92% since the last closing and was traded between 59.73 USD and 60.27 USD over the period. The price is currently at +0.74% from its lowest and -0.17% from its highest.The Central Gaps scanner detects a bullish opening. A small advantage for buyers in the very short term.
Bullish opening
Type : Bullish
Timeframe : Openning
So that you have an overall view of the price change, here is a table showing the variations over several periods:
Near a new LOW record (1st january)
Type : Bearish
Timeframe : Weekly
Near a new HIGH record (1 month)
Type : Bullish
Timeframe : Weekly
Technical
Technical analysis of COCA-COLA CO. in Daily shows an overall bearish trend. The signals given by moving averages are 67.86% bearish. This bearish trend is reinforced by the strong signals currently being given by short-term moving averages. An assessment of moving averages reveals a bullish signal that could impact this trend:
Bullish price crossover with Moving Average 100
Type : Bullish
Timeframe : Daily
On the 18 technical indicators analysed, 7 are bullish, 5 are neutral and 6 are bearish. Caution: the Central Indicators scanner currently detects an excess:
CCI indicator: bullish divergence
Type : Bullish
Timeframe : Daily
MACD indicator: bullish divergence
Type : Bullish
Timeframe : Daily
Pivot points : price is over resistance 1
Type : Neutral
Timeframe : Daily
An analysis of the price chart with the Central Patterns scanner (detector of chart patterns and resistances and supports) shows several results that can have an impact on the price change:
Near horizontal resistance
Type : Bearish
Timeframe : Daily
Near support of channel
Type : Bullish
Timeframe : Daily
No result was found by the Central Candlesticks scanner on Japanese candlesticks.
| S3 | S2 | S1 | Price | R1 | R2 | R3 | |
|---|---|---|---|---|---|---|---|
| ProTrendLines | 54.78 | 56.38 | 58.28 | 60.17 | 60.49 | 62.08 | 64.80 |
| Change (%) | -8.96% | -6.30% | -3.14% | - | +0.53% | +3.17% | +7.69% |
| Change | -5.39 | -3.79 | -1.89 | - | +0.32 | +1.91 | +4.63 |
| Level | Major | Minor | Major | - | Major | Intermediate | Major |
Pivot points can also be used to set your price objectives. Here is the price situation in relation to pivot points:
| Pivot points | S3 | S2 | S1 | PP | R1 | R2 | R3 |
|---|---|---|---|---|---|---|---|
| Standard | 58.01 | 58.45 | 59.03 | 59.47 | 60.05 | 60.49 | 61.07 |
| Camarilla | 59.34 | 59.43 | 59.53 | 59.62 | 59.71 | 59.81 | 59.90 |
| Woodie | 58.09 | 58.49 | 59.11 | 59.51 | 60.13 | 60.53 | 61.15 |
| Fibonacci | 58.45 | 58.84 | 59.08 | 59.47 | 59.86 | 60.10 | 60.49 |
| Pivot points | S3 | S2 | S1 | PP | R1 | R2 | R3 |
|---|---|---|---|---|---|---|---|
| Standard | 57.43 | 58.15 | 58.89 | 59.61 | 60.35 | 61.07 | 61.81 |
| Camarilla | 59.22 | 59.35 | 59.49 | 59.62 | 59.75 | 59.89 | 60.02 |
| Woodie | 57.43 | 58.16 | 58.89 | 59.62 | 60.35 | 61.08 | 61.81 |
| Fibonacci | 58.15 | 58.71 | 59.06 | 59.61 | 60.17 | 60.52 | 61.07 |
| Pivot points | S3 | S2 | S1 | PP | R1 | R2 | R3 |
|---|---|---|---|---|---|---|---|
| Standard | 54.92 | 57.16 | 59.24 | 61.48 | 63.56 | 65.80 | 67.88 |
| Camarilla | 60.13 | 60.53 | 60.92 | 61.32 | 61.72 | 62.11 | 62.51 |
| Woodie | 54.84 | 57.12 | 59.16 | 61.44 | 63.48 | 65.76 | 67.80 |
| Fibonacci | 57.16 | 58.81 | 59.83 | 61.48 | 63.13 | 64.15 | 65.80 |
Numerical data
The following is the status of the technical indicators and moving averages at the time of publication of this technical analysis:
| RSI (14): | 43.99 | |
| MACD (12,26,9): | -0.5500 | |
| Directional Movement: | -9.00 | |
| AROON (14): | -50.00 | |
| DEMA (21): | 59.81 | |
| Parabolic SAR (0,02-0,02-0,2): | 61.26 | |
| Elder Ray (13): | -0.27 | |
| Super Trend (3,10): | 61.99 | |
| Zig ZAG (10): | 60.17 | |
| VORTEX (21): | 0.8900 | |
| Stochastique (14,3,5): | 31.21 | |
| TEMA (21): | 59.53 | |
| Williams %R (14): | -50.19 | |
| Chande Momentum Oscillator (20): | -0.58 | |
| Repulse (5,40,3): | 0.6900 | |
| ROCnROLL: | -1 | |
| TRIX (15,9): | -0.1400 | |
| Courbe Coppock: | 1.74 |
| MA7: | 59.89 | |
| MA20: | 60.35 | |
| MA50: | 62.06 | |
| MA100: | 60.12 | |
| MAexp7: | 60.01 | |
| MAexp20: | 60.53 | |
| MAexp50: | 61.07 | |
| MAexp100: | 60.97 | |
| Price / MA7: | +0.47% | |
| Price / MA20: | -0.30% | |
| Price / MA50: | -3.05% | |
| Price / MA100: | +0.08% | |
| Price / MAexp7: | +0.27% | |
| Price / MAexp20: | -0.59% | |
| Price / MAexp50: | -1.47% | |
| Price / MAexp100: | -1.31% |
News
Don't forget to follow the news on COCA-COLA CO.. At the time of publication of this analysis, the latest news was as follows:
- 01/26/2023 - 14:00 Berry, Coca-Cola Collaborate to implement Tethered caps in EU markets
- 01/12/2023 - 15:00 The Coca-Cola Company Announces Timing of Fourth Quarter and Full Year 2022 Earnings Release
- 12/20/2022 - 13:00 Pop Culture Group Assists COFCO Coca-Cola Beverage Limited Beijing Factory to Successfully Hold 2023 Chinese New Year Kickoff Conference
- 12/14/2022 - 14:00 The Coca-Cola Company Partners with Musical Legends Mark Ronson and Madlib to Launch “Recycled Records”
- 11/30/2022 - 13:00 The Coca-Cola Company Names Henrique Braun to Newly Created Role of President, International Development
About author

Online


Add a comment
Comments
0 comments on the analysis COCA-COLA CO. - Daily