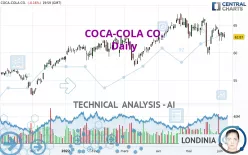
COCA-COLA CO. - Daily - Technical analysis published on 06/06/2022 (GMT)
- 328
- 0
Click here for a new analysis!
- Timeframe : Daily
- - Analysis generated on
- Status : TARGET REACHED

Summary of the analysis

Additional analysis
Quotes
The COCA-COLA CO. rating is 62.87 USD. The price is lower by -0.16% since the last closing and was traded between 62.66 USD and 63.77 USD over the period. The price is currently at +0.34% from its lowest and -1.41% from its highest.The Central Gaps scanner detects a bullish opening marking the presence of buyers ahead of sellers at the opening but not sufficiently marked to allow the price to register a quotation gap.
Bullish opening
Type : Bullish
Timeframe : Openning
Here is a more detailed summary of the historical variations registered by COCA-COLA CO.:
Near a new LOW record (1 month)
Type : Bearish
Timeframe : Weekly
Technical
Technical analysis of this Daily chart of COCA-COLA CO. indicates that the overall trend is slightly bullish. 53.57% of the signals given by moving averages are bullish. Caution: the strong bearish signals currently being given by short-term moving averages indicate that this slightly bullish trend could be reversed. The Central Indicators scanner detects a bearish signal on moving averages that could impact this trend:
Bearish price crossover with adaptative moving average 100
Type : Bearish
Timeframe : Daily
On the 18 technical indicators analysed, 4 are bullish, 8 are neutral and 6 are bearish. Central Indicators, the detector scanner for these technical indicators has recently detected several signals:
Price is back under the pivot point
Type : Bearish
Timeframe : Daily
Price is back under the pivot point
Type : Bearish
Timeframe : Weekly
Momentum indicator is back over 0
Type : Bullish
Timeframe : Daily
Central Patterns, the market scanner focusing on chart patterns, resistances and supports found these results:
Near horizontal support
Type : Bullish
Timeframe : Daily
Near support of triangle
Type : Bullish
Timeframe : Daily
The Central Candlesticks scanner which studies Japanese candlesticks did not detect anything.
| S3 | S2 | S1 | Price | R1 | R2 | |
|---|---|---|---|---|---|---|
| ProTrendLines | 55.98 | 59.94 | 62.37 | 62.87 | 65.03 | 66.21 |
| Change (%) | -10.96% | -4.66% | -0.80% | - | +3.44% | +5.31% |
| Change | -6.89 | -2.93 | -0.50 | - | +2.16 | +3.34 |
| Level | Major | Major | Intermediate | - | Intermediate | Major |
Attention could also be paid to pivot points to set price objectives:
| Pivot points | S3 | S2 | S1 | PP | R1 | R2 | R3 |
|---|---|---|---|---|---|---|---|
| Standard | 61.32 | 61.99 | 62.43 | 63.10 | 63.54 | 64.21 | 64.65 |
| Camarilla | 62.57 | 62.67 | 62.77 | 62.87 | 62.97 | 63.07 | 63.18 |
| Woodie | 61.21 | 61.93 | 62.32 | 63.04 | 63.43 | 64.15 | 64.54 |
| Fibonacci | 61.99 | 62.41 | 62.68 | 63.10 | 63.52 | 63.79 | 64.21 |
| Pivot points | S3 | S2 | S1 | PP | R1 | R2 | R3 |
|---|---|---|---|---|---|---|---|
| Standard | 59.74 | 60.92 | 61.95 | 63.13 | 64.16 | 65.34 | 66.37 |
| Camarilla | 62.36 | 62.57 | 62.77 | 62.97 | 63.17 | 63.38 | 63.58 |
| Woodie | 59.66 | 60.88 | 61.87 | 63.09 | 64.08 | 65.30 | 66.29 |
| Fibonacci | 60.92 | 61.77 | 62.29 | 63.13 | 63.98 | 64.50 | 65.34 |
| Pivot points | S3 | S2 | S1 | PP | R1 | R2 | R3 |
|---|---|---|---|---|---|---|---|
| Standard | 53.18 | 56.42 | 59.90 | 63.14 | 66.62 | 69.86 | 73.34 |
| Camarilla | 61.53 | 62.15 | 62.76 | 63.38 | 64.00 | 64.61 | 65.23 |
| Woodie | 53.30 | 56.48 | 60.02 | 63.20 | 66.74 | 69.92 | 73.46 |
| Fibonacci | 56.42 | 58.99 | 60.57 | 63.14 | 65.71 | 67.29 | 69.86 |
Numerical data
The following are the details of the technical indicators and moving averages that were collected to generate this technical analysis:
| RSI (14): | 46.17 | |
| MACD (12,26,9): | -0.2000 | |
| Directional Movement: | -5.86 | |
| AROON (14): | -21.43 | |
| DEMA (21): | 63.38 | |
| Parabolic SAR (0,02-0,02-0,2): | 60.28 | |
| Elder Ray (13): | -0.24 | |
| Super Trend (3,10): | 65.33 | |
| Zig ZAG (10): | 62.87 | |
| VORTEX (21): | 0.9100 | |
| Stochastique (14,3,5): | 53.22 | |
| TEMA (21): | 62.98 | |
| Williams %R (14): | -50.16 | |
| Chande Momentum Oscillator (20): | 1.67 | |
| Repulse (5,40,3): | -1.0700 | |
| ROCnROLL: | 2 | |
| TRIX (15,9): | -0.0400 | |
| Courbe Coppock: | 2.32 |
| MA7: | 63.57 | |
| MA20: | 63.65 | |
| MA50: | 63.89 | |
| MA100: | 62.14 | |
| MAexp7: | 63.30 | |
| MAexp20: | 63.58 | |
| MAexp50: | 63.30 | |
| MAexp100: | 61.98 | |
| Price / MA7: | -1.10% | |
| Price / MA20: | -1.23% | |
| Price / MA50: | -1.60% | |
| Price / MA100: | +1.17% | |
| Price / MAexp7: | -0.68% | |
| Price / MAexp20: | -1.12% | |
| Price / MAexp50: | -0.68% | |
| Price / MAexp100: | +1.44% |
News
The last news published on COCA-COLA CO. at the time of the generation of this analysis was as follows:
- O’Charley’s Announces ‘Drive For 5’ Promotion and NASCAR Sweepstakes with Coca-Cola Company
- SEGI.TV Sponsors Floyd Mayweather's TMT Racing for The Coca-Cola 600
- The Coca-Cola Company to Participate in Upcoming Investor Conferences
- FIFA World Cup™ Trophy Tour by Coca-Cola Kicks Off Global Journey in Dubai
- Thinking about trading options or stock in Alibaba, ConocoPhillips, GameStop, Coca-Cola, or Bank of America?
About author

Online


Add a comment
Comments
0 comments on the analysis COCA-COLA CO. - Daily