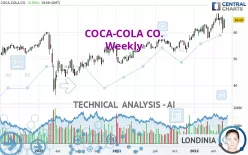
COCA-COLA CO. - Weekly - Technical analysis published on 05/31/2022 (GMT)
- 278
- 0
Click here for a new analysis!
- Timeframe : Weekly
- - Analysis generated on
- Status : INVALID

Summary of the analysis

Additional analysis
Quotes
The COCA-COLA CO. rating is 64.68 USD. Over 5 days, this instrument gained +1.03% with the lowest point at 64.14 USD and the highest point at 64.83 USD. The deviation from the price is +0.84% for the low point and -0.23% for the high point.A bearish opening was detected by the Central Gaps scanner. Sellers are trying to impose a bearish trend in the very short term.
Bearish opening
Type : Bearish
Timeframe : Openning
So that you have an overall view of the price change, here is a table showing the variations over several periods:
Near a new HIGH record (5 years)
Type : Bullish
Timeframe : Weekly
Near a new HIGH record (1 year)
Type : Bullish
Timeframe : Weekly
Near a new HIGH record (1st january)
Type : Bullish
Timeframe : Weekly
Near a new HIGH record (1 month)
Type : Bullish
Timeframe : Weekly
Technical
A technical analysis in Weekly of this COCA-COLA CO. chart shows a strongly bullish trend. 92.86% of the signals given by moving averages are bullish. This strongly bullish trend is supported by the strong bullish signals given by short-term moving averages. The Central Indicators market scanner is currently detecting several bullish signals that could impact this trend:
Bullish price crossover with Moving Average 20
Type : Bullish
Timeframe : Weekly
Bullish price crossover with adaptative moving average 20
Type : Bullish
Timeframe : Weekly
The probability of a further increase is slight given the direction of the technical indicators.
Central Indicators, the detector scanner for these technical indicators has recently detected several signals:
Price is back over the pivot point
Type : Bullish
Timeframe : Weekly
Momentum indicator is back over 0
Type : Bullish
Timeframe : Weekly
Williams %R indicator is back over -50
Type : Bullish
Timeframe : Weekly
An analysis of the price chart with the Central Patterns scanner (detector of chart patterns and resistances and supports) shows a result that can have an impact on the price change:
Near horizontal resistance
Type : Bearish
Timeframe : Weekly
Central Candlesticks, the scanner specialised in Japanese candlesticks, detects a bullish signal that could support the hypothesis of a small rebound in the very short term:
Bullish harami
Type : Bullish
Timeframe : Weekly
| S3 | S2 | S1 | Price | R1 | |
|---|---|---|---|---|---|
| ProTrendLines | 40.35 | 45.44 | 55.98 | 64.68 | 66.21 |
| Change (%) | -37.62% | -29.75% | -13.45% | - | +2.37% |
| Change | -24.33 | -19.24 | -8.70 | - | +1.53 |
| Level | Minor | Intermediate | Major | - | Major |
To determine price objectives, it is also possible to use the pivot points. Here is the price position in relation to pivot points:
| Pivot points | S3 | S2 | S1 | PP | R1 | R2 | R3 |
|---|---|---|---|---|---|---|---|
| Standard | 63.58 | 63.86 | 64.27 | 64.55 | 64.96 | 65.24 | 65.65 |
| Camarilla | 64.49 | 64.55 | 64.62 | 64.68 | 64.74 | 64.81 | 64.87 |
| Woodie | 63.65 | 63.89 | 64.34 | 64.58 | 65.03 | 65.27 | 65.72 |
| Fibonacci | 63.86 | 64.12 | 64.29 | 64.55 | 64.81 | 64.98 | 65.24 |
| Pivot points | S3 | S2 | S1 | PP | R1 | R2 | R3 |
|---|---|---|---|---|---|---|---|
| Standard | 51.58 | 55.62 | 58.30 | 62.34 | 65.02 | 69.06 | 71.74 |
| Camarilla | 59.13 | 59.75 | 60.36 | 60.98 | 61.60 | 62.21 | 62.83 |
| Woodie | 50.90 | 55.28 | 57.62 | 62.00 | 64.34 | 68.72 | 71.06 |
| Fibonacci | 55.62 | 58.19 | 59.77 | 62.34 | 64.91 | 66.49 | 69.06 |
| Pivot points | S3 | S2 | S1 | PP | R1 | R2 | R3 |
|---|---|---|---|---|---|---|---|
| Standard | 56.34 | 59.03 | 61.82 | 64.51 | 67.30 | 69.99 | 72.78 |
| Camarilla | 63.10 | 63.61 | 64.11 | 64.61 | 65.11 | 65.62 | 66.12 |
| Woodie | 56.39 | 59.06 | 61.87 | 64.54 | 67.35 | 70.02 | 72.83 |
| Fibonacci | 59.03 | 61.12 | 62.42 | 64.51 | 66.60 | 67.90 | 69.99 |
Numerical data
The following are the details of the technical indicators and moving averages that were collected to generate this technical analysis:
| RSI (14): | 59.33 | |
| MACD (12,26,9): | 1.9800 | |
| Directional Movement: | -2.62 | |
| AROON (14): | 50.00 | |
| DEMA (21): | 64.74 | |
| Parabolic SAR (0,02-0,02-0,2): | 67.05 | |
| Elder Ray (13): | 0.28 | |
| Super Trend (3,10): | 58.75 | |
| Zig ZAG (10): | 64.68 | |
| VORTEX (21): | 1.0400 | |
| Stochastique (14,3,5): | 66.40 | |
| TEMA (21): | 65.06 | |
| Williams %R (14): | -24.85 | |
| Chande Momentum Oscillator (20): | 2.59 | |
| Repulse (5,40,3): | 1.2000 | |
| ROCnROLL: | 1 | |
| TRIX (15,9): | 0.5200 | |
| Courbe Coppock: | 12.26 |
| MA7: | 62.99 | |
| MA20: | 63.89 | |
| MA50: | 63.62 | |
| MA100: | 61.98 | |
| MAexp7: | 63.79 | |
| MAexp20: | 62.06 | |
| MAexp50: | 58.54 | |
| MAexp100: | 54.89 | |
| Price / MA7: | +2.68% | |
| Price / MA20: | +1.24% | |
| Price / MA50: | +1.67% | |
| Price / MA100: | +4.36% | |
| Price / MAexp7: | +1.40% | |
| Price / MAexp20: | +4.22% | |
| Price / MAexp50: | +10.49% | |
| Price / MAexp100: | +17.84% |
News
The latest news and videos published on COCA-COLA CO. at the time of the analysis were as follows:
- The Coca-Cola Company to Participate in Upcoming Investor Conferences
- FIFA World Cup™ Trophy Tour by Coca-Cola Kicks Off Global Journey in Dubai
- Thinking about trading options or stock in Alibaba, ConocoPhillips, GameStop, Coca-Cola, or Bank of America?
- Thinking about trading options or stock in Ford Motor, Coca-Cola, Teladoc Health, PayPal, or Comcast?
- Coca-Cola Board of Directors Declares Regular Quarterly Dividend
About author

Online


Add a comment
Comments
0 comments on the analysis COCA-COLA CO. - Weekly