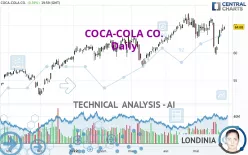
COCA-COLA CO. - Daily - Technical analysis published on 05/31/2022 (GMT)
- 243
- 0
Click here for a new analysis!
- Timeframe : Daily
- - Analysis generated on
- Status : INVALID

Summary of the analysis

Additional analysis
Quotes
The COCA-COLA CO. price is 64.68 USD. The price registered an increase of +0.59% on the session and was between 64.14 USD and 64.83 USD. This implies that the price is at +0.84% from its lowest and at -0.23% from its highest.A bearish opening was detected by the Central Gaps scanner. Sellers are trying to impose a bearish trend in the very short term.
Bearish opening
Type : Bearish
Timeframe : Openning
Here is a more detailed summary of the historical variations registered by COCA-COLA CO.:
Near a new HIGH record (5 years)
Type : Bullish
Timeframe : Weekly
Near a new HIGH record (1 year)
Type : Bullish
Timeframe : Weekly
Near a new HIGH record (1st january)
Type : Bullish
Timeframe : Weekly
Near a new HIGH record (1 month)
Type : Bullish
Timeframe : Weekly
Technical
Technical analysis of this Daily chart of COCA-COLA CO. indicates that the overall trend is strongly bullish. 92.86% of the signals given by moving averages are bullish. This strongly bullish trend is supported by the strong bullish signals given by short-term moving averages. An assessment of moving averages reveals a bullish signal that could impact this trend:
Bullish price crossover with adaptative moving average 20
Type : Bullish
Timeframe : Daily
The technical indicators are bullish. There is still some doubt about the price increase.
Central Indicators, the scanner specialised in technical indicators, has identified these signals:
MACD crosses UP its Moving Average
Type : Bullish
Timeframe : Daily
Price is back over the pivot point
Type : Bullish
Timeframe : Daily
Price is back over the pivot point
Type : Bullish
Timeframe : Weekly
No signals are given by Central Patterns, a market scanner specialised in chart patterns, resistances and supports.
The Central Candlesticks scanner, specialised in Japanese candlesticks, did not identify any signals.
| S3 | S2 | S1 | Price | R1 | R2 | |
|---|---|---|---|---|---|---|
| ProTrendLines | 55.98 | 59.89 | 63.08 | 64.68 | 65.03 | 66.21 |
| Change (%) | -13.45% | -7.41% | -2.47% | - | +0.54% | +2.37% |
| Change | -8.70 | -4.79 | -1.60 | - | +0.35 | +1.53 |
| Level | Major | Intermediate | Major | - | Major | Major |
To determine price objectives, it is also possible to use the pivot points. Here is the price position in relation to pivot points:
| Pivot points | S3 | S2 | S1 | PP | R1 | R2 | R3 |
|---|---|---|---|---|---|---|---|
| Standard | 63.58 | 63.86 | 64.27 | 64.55 | 64.96 | 65.24 | 65.65 |
| Camarilla | 64.49 | 64.55 | 64.62 | 64.68 | 64.74 | 64.81 | 64.87 |
| Woodie | 63.65 | 63.89 | 64.34 | 64.58 | 65.03 | 65.27 | 65.72 |
| Fibonacci | 63.86 | 64.12 | 64.29 | 64.55 | 64.81 | 64.98 | 65.24 |
| Pivot points | S3 | S2 | S1 | PP | R1 | R2 | R3 |
|---|---|---|---|---|---|---|---|
| Standard | 58.97 | 60.28 | 62.48 | 63.79 | 65.99 | 67.30 | 69.50 |
| Camarilla | 63.72 | 64.04 | 64.36 | 64.68 | 65.00 | 65.32 | 65.65 |
| Woodie | 59.42 | 60.50 | 62.93 | 64.01 | 66.44 | 67.52 | 69.95 |
| Fibonacci | 60.28 | 61.62 | 62.45 | 63.79 | 65.13 | 65.96 | 67.30 |
| Pivot points | S3 | S2 | S1 | PP | R1 | R2 | R3 |
|---|---|---|---|---|---|---|---|
| Standard | 56.34 | 59.03 | 61.82 | 64.51 | 67.30 | 69.99 | 72.78 |
| Camarilla | 63.10 | 63.61 | 64.11 | 64.61 | 65.11 | 65.62 | 66.12 |
| Woodie | 56.39 | 59.06 | 61.87 | 64.54 | 67.35 | 70.02 | 72.83 |
| Fibonacci | 59.03 | 61.12 | 62.42 | 64.51 | 66.60 | 67.90 | 69.99 |
Numerical data
The following are the details of the technical indicators and moving averages that were collected to generate this technical analysis:
| RSI (14): | 54.02 | |
| MACD (12,26,9): | -0.0600 | |
| Directional Movement: | 3.42 | |
| AROON (14): | -21.43 | |
| DEMA (21): | 63.82 | |
| Parabolic SAR (0,02-0,02-0,2): | 59.77 | |
| Elder Ray (13): | 0.71 | |
| Super Trend (3,10): | 65.33 | |
| Zig ZAG (10): | 64.68 | |
| VORTEX (21): | 0.9500 | |
| Stochastique (14,3,5): | 69.79 | |
| TEMA (21): | 63.41 | |
| Williams %R (14): | -25.30 | |
| Chande Momentum Oscillator (20): | 0.37 | |
| Repulse (5,40,3): | 1.5100 | |
| ROCnROLL: | 1 | |
| TRIX (15,9): | -0.0200 | |
| Courbe Coppock: | 3.10 |
| MA7: | 62.99 | |
| MA20: | 63.89 | |
| MA50: | 63.62 | |
| MA100: | 61.98 | |
| MAexp7: | 63.82 | |
| MAexp20: | 63.84 | |
| MAexp50: | 63.33 | |
| MAexp100: | 61.85 | |
| Price / MA7: | +2.68% | |
| Price / MA20: | +1.24% | |
| Price / MA50: | +1.67% | |
| Price / MA100: | +4.36% | |
| Price / MAexp7: | +1.35% | |
| Price / MAexp20: | +1.32% | |
| Price / MAexp50: | +2.13% | |
| Price / MAexp100: | +4.58% |
News
Don't forget to follow the news on COCA-COLA CO.. At the time of publication of this analysis, the latest news was as follows:
- The Coca-Cola Company to Participate in Upcoming Investor Conferences
- FIFA World Cup™ Trophy Tour by Coca-Cola Kicks Off Global Journey in Dubai
- Thinking about trading options or stock in Alibaba, ConocoPhillips, GameStop, Coca-Cola, or Bank of America?
- Thinking about trading options or stock in Ford Motor, Coca-Cola, Teladoc Health, PayPal, or Comcast?
- Coca-Cola Board of Directors Declares Regular Quarterly Dividend
About author

Online


Add a comment
Comments
0 comments on the analysis COCA-COLA CO. - Daily