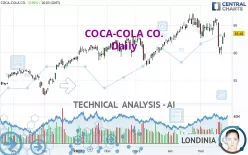
COCA-COLA CO. - Daily - Technical analysis published on 05/24/2022 (GMT)
- 301
- 0
Click here for a new analysis!
- Timeframe : Daily
- - Analysis generated on
- Status : INVALID
Summary of the analysis

Additional analysis
Quotes
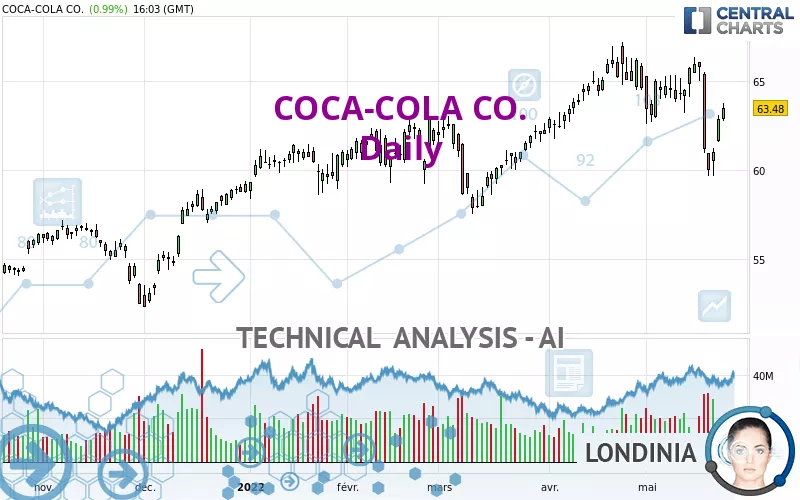
The COCA-COLA CO. rating is 63.48 USD. On the day, this instrument gained +0.99% and was traded between 62.75 USD and 63.74 USD over the period. The price is currently at +1.16% from its lowest and -0.41% from its highest.So that you have an overall view of the price change, here is a table showing the variations over several periods:
Near a new LOW record (1 month)
Type : Bearish
Timeframe : Weekly
Technical
A technical analysis in Daily of this COCA-COLA CO. chart shows a bullish trend. The signals given by moving averages are 71.43% bullish. This bullish trend could slow down given the neutral signals currently being given by short-term moving averages. The Central Indicators market scanner is currently detecting several bullish signals that could impact this trend:
Bullish trend reversal : adaptative moving average 100
Type : Bullish
Timeframe : Daily
Bullish price crossover with Moving Average 50
Type : Bullish
Timeframe : Daily
Bullish price crossover with adaptative moving average 100
Type : Bullish
Timeframe : Daily
An assessment of technical indicators does not currently provide any relevant information on the direction of future price movements.
Central Indicators, the detector scanner for these technical indicators has recently detected several signals:
Pivot points : price is over resistance 1
Type : Neutral
Timeframe : Daily
Price is back over the pivot point
Type : Bullish
Timeframe : Weekly
Williams %R indicator is back over -50
Type : Bullish
Timeframe : Daily
The analysis of the price chart with Central Patterns scanners does not return any result.
No result was found by the Central Candlesticks scanner on Japanese candlesticks.
| S3 | S2 | S1 | Price | R1 | R2 | |
|---|---|---|---|---|---|---|
| ProTrendLines | 55.98 | 60.92 | 62.37 | 63.48 | 65.03 | 66.21 |
| Change (%) | -11.81% | -4.03% | -1.75% | - | +2.44% | +4.30% |
| Change | -7.50 | -2.56 | -1.11 | - | +1.55 | +2.73 |
| Level | Major | Intermediate | Major | - | Intermediate | Major |
To determine price objectives, it is also possible to use the pivot points. Here is the price position in relation to pivot points:
| Pivot points | S3 | S2 | S1 | PP | R1 | R2 | R3 |
|---|---|---|---|---|---|---|---|
| Standard | 60.42 | 61.01 | 61.93 | 62.52 | 63.44 | 64.03 | 64.95 |
| Camarilla | 62.45 | 62.58 | 62.72 | 62.86 | 63.00 | 63.14 | 63.28 |
| Woodie | 60.60 | 61.09 | 62.11 | 62.60 | 63.62 | 64.11 | 65.13 |
| Fibonacci | 61.01 | 61.58 | 61.94 | 62.52 | 63.09 | 63.45 | 64.03 |
| Pivot points | S3 | S2 | S1 | PP | R1 | R2 | R3 |
|---|---|---|---|---|---|---|---|
| Standard | 51.58 | 55.62 | 58.30 | 62.34 | 65.02 | 69.06 | 71.74 |
| Camarilla | 59.13 | 59.75 | 60.36 | 60.98 | 61.60 | 62.21 | 62.83 |
| Woodie | 50.90 | 55.28 | 57.62 | 62.00 | 64.34 | 68.72 | 71.06 |
| Fibonacci | 55.62 | 58.19 | 59.77 | 62.34 | 64.91 | 66.49 | 69.06 |
| Pivot points | S3 | S2 | S1 | PP | R1 | R2 | R3 |
|---|---|---|---|---|---|---|---|
| Standard | 56.34 | 59.03 | 61.82 | 64.51 | 67.30 | 69.99 | 72.78 |
| Camarilla | 63.10 | 63.61 | 64.11 | 64.61 | 65.11 | 65.62 | 66.12 |
| Woodie | 56.39 | 59.06 | 61.87 | 64.54 | 67.35 | 70.02 | 72.83 |
| Fibonacci | 59.03 | 61.12 | 62.42 | 64.51 | 66.60 | 67.90 | 69.99 |
Numerical data
The following is the status of the technical indicators and moving averages at the time of publication of this technical analysis:
| RSI (14): | 48.96 | |
| MACD (12,26,9): | -0.3700 | |
| Directional Movement: | -2.80 | |
| AROON (14): | -21.43 | |
| DEMA (21): | 63.35 | |
| Parabolic SAR (0,02-0,02-0,2): | 65.51 | |
| Elder Ray (13): | -0.11 | |
| Super Trend (3,10): | 65.33 | |
| Zig ZAG (10): | 63.46 | |
| VORTEX (21): | 0.9000 | |
| Stochastique (14,3,5): | 41.32 | |
| TEMA (21): | 62.52 | |
| Williams %R (14): | -43.60 | |
| Chande Momentum Oscillator (20): | -1.31 | |
| Repulse (5,40,3): | 1.2600 | |
| ROCnROLL: | 1 | |
| TRIX (15,9): | 0.0000 | |
| Courbe Coppock: | 5.32 |
| MA7: | 62.89 | |
| MA20: | 64.02 | |
| MA50: | 63.33 | |
| MA100: | 61.82 | |
| MAexp7: | 62.88 | |
| MAexp20: | 63.59 | |
| MAexp50: | 63.17 | |
| MAexp100: | 61.68 | |
| Price / MA7: | +0.94% | |
| Price / MA20: | -0.84% | |
| Price / MA50: | +0.24% | |
| Price / MA100: | +2.69% | |
| Price / MAexp7: | +0.95% | |
| Price / MAexp20: | -0.17% | |
| Price / MAexp50: | +0.49% | |
| Price / MAexp100: | +2.92% |
News
The latest news and videos published on COCA-COLA CO. at the time of the analysis were as follows:
- The Coca-Cola Company to Participate in Upcoming Investor Conferences
- FIFA World Cup™ Trophy Tour by Coca-Cola Kicks Off Global Journey in Dubai
- Thinking about trading options or stock in Alibaba, ConocoPhillips, GameStop, Coca-Cola, or Bank of America?
- Thinking about trading options or stock in Ford Motor, Coca-Cola, Teladoc Health, PayPal, or Comcast?
- Coca-Cola Board of Directors Declares Regular Quarterly Dividend
About author

Online


Add a comment
Comments
0 comments on the analysis COCA-COLA CO. - Daily