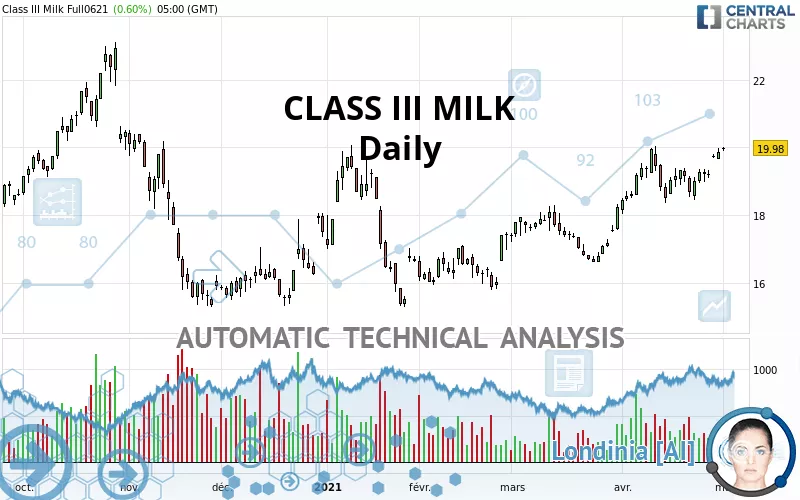
CLASS III MILK - Daily - Technical analysis published on 05/03/2021 (GMT)
- 277
- 0
Click here for a new analysis!
- Timeframe : Daily
- - Analysis generated on
- Status : INVALID
Summary of the analysis

Additional analysis
Quotes
The CLASS III MILK price is 19.98 USD. The price has increased by +0.60% since the last closing with the lowest point at 19.88 USD and the highest point at 20.00 USD. The deviation from the price is +0.50% for the low point and -0.10% for the high point.A bullish opening was detected by the Central Gaps scanner. Buyers are trying to impose a bullish momentum in the very short term.
Bullish opening
Type : Bullish
Timeframe : Openning
So that you have an overall view of the price change, here is a table showing the variations over several periods:
Near a new HIGH record (1st january)
Type : Bullish
Timeframe : Weekly
Near a new HIGH record (1 month)
Type : Bullish
Timeframe : Weekly
Technical
Technical analysis of this Daily chart of CLASS III MILK indicates that the overall trend is strongly bullish. The signals given by the moving averages are 92.86% bullish. This strong bullish trend is confirmed by the strong signals currently being given by short-term moving averages. The Central Indicators market scanner currently does not detect any result that concerns moving averages.
An assessment of technical indicators shows a strong bullish signal.
Caution: the Central Indicators scanner currently detects an excess:
CCI indicator is overbought : over 100
Type : Neutral
Timeframe : Daily
Williams %R indicator is overbought : over -20
Type : Neutral
Timeframe : Daily
MACD crosses UP its Moving Average
Type : Bullish
Timeframe : Daily
Price is back over the pivot point
Type : Bullish
Timeframe : Daily
Price is back over the pivot point
Type : Bullish
Timeframe : Weekly
The analysis of the price chart with Central Patterns scanners does not return any result.
The Central Candlesticks scanner which studies Japanese candlesticks did not detect anything.
| S3 | S2 | S1 | Price | R1 | R2 | R3 | |
|---|---|---|---|---|---|---|---|
| ProTrendLines | 17.50 | 18.68 | 19.86 | 19.98 | 21.27 | 23.40 | 25.00 |
| Change (%) | -12.41% | -6.51% | -0.60% | - | +6.46% | +17.12% | +25.13% |
| Change | -2.48 | -1.30 | -0.12 | - | +1.29 | +3.42 | +5.02 |
| Level | Major | Minor | Major | - | Major | Major | Minor |
To determine price objectives, it is also possible to use the pivot points. Here is the price position in relation to pivot points:
| Pivot points | S3 | S2 | S1 | PP | R1 | R2 | R3 |
|---|---|---|---|---|---|---|---|
| Standard | 19.34 | 19.50 | 19.68 | 19.84 | 20.02 | 20.18 | 20.36 |
| Camarilla | 19.78 | 19.81 | 19.84 | 19.87 | 19.90 | 19.93 | 19.96 |
| Woodie | 19.36 | 19.51 | 19.70 | 19.85 | 20.04 | 20.19 | 20.38 |
| Fibonacci | 19.50 | 19.63 | 19.71 | 19.84 | 19.97 | 20.05 | 20.18 |
| Pivot points | S3 | S2 | S1 | PP | R1 | R2 | R3 |
|---|---|---|---|---|---|---|---|
| Standard | 18.18 | 18.56 | 19.22 | 19.60 | 20.26 | 20.64 | 21.30 |
| Camarilla | 19.58 | 19.68 | 19.78 | 19.87 | 19.97 | 20.06 | 20.16 |
| Woodie | 18.31 | 18.63 | 19.35 | 19.67 | 20.39 | 20.71 | 21.43 |
| Fibonacci | 18.56 | 18.96 | 19.21 | 19.60 | 20.00 | 20.25 | 20.64 |
| Pivot points | S3 | S2 | S1 | PP | R1 | R2 | R3 |
|---|---|---|---|---|---|---|---|
| Standard | 17.08 | 17.71 | 18.79 | 19.42 | 20.50 | 21.13 | 22.21 |
| Camarilla | 19.40 | 19.56 | 19.71 | 19.87 | 20.03 | 20.18 | 20.34 |
| Woodie | 17.31 | 17.82 | 19.02 | 19.53 | 20.73 | 21.24 | 22.44 |
| Fibonacci | 17.71 | 18.36 | 18.77 | 19.42 | 20.07 | 20.48 | 21.13 |
Numerical data
The following are the details of the technical indicators and moving averages that were collected to generate this technical analysis:
| RSI (14): | 65.16 | |
| MACD (12,26,9): | 0.4500 | |
| Directional Movement: | 16.07 | |
| AROON (14): | -14.29 | |
| DEMA (21): | 19.71 | |
| Parabolic SAR (0,02-0,02-0,2): | 18.43 | |
| Elder Ray (13): | 0.60 | |
| Super Trend (3,10): | 18.62 | |
| Zig ZAG (10): | 19.97 | |
| VORTEX (21): | 1.1200 | |
| Stochastique (14,3,5): | 90.24 | |
| TEMA (21): | 19.80 | |
| Williams %R (14): | -1.21 | |
| Chande Momentum Oscillator (20): | 1.47 | |
| Repulse (5,40,3): | 1.5500 | |
| ROCnROLL: | 1 | |
| TRIX (15,9): | 0.3500 | |
| Courbe Coppock: | 3.61 |
| MA7: | 19.47 | |
| MA20: | 19.25 | |
| MA50: | 18.13 | |
| MA100: | 17.51 | |
| MAexp7: | 19.57 | |
| MAexp20: | 19.10 | |
| MAexp50: | 18.39 | |
| MAexp100: | 18.01 | |
| Price / MA7: | +2.62% | |
| Price / MA20: | +3.79% | |
| Price / MA50: | +10.20% | |
| Price / MA100: | +14.11% | |
| Price / MAexp7: | +2.10% | |
| Price / MAexp20: | +4.61% | |
| Price / MAexp50: | +8.65% | |
| Price / MAexp100: | +10.94% |
About author

Online


Add a comment
Comments
0 comments on the analysis CLASS III MILK - Daily