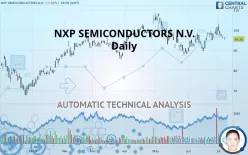
NXP SEMICONDUCTORS N.V. - Daily - Technical analysis published on 07/09/2019 (GMT)
- 408
- 0
- Who voted?
- Timeframe : Daily
- - Analysis generated on
- Status : NEUTRAL

Summary of the analysis
Trends
Court terme:
Bearish
De fond:
Neutral
Technical indicators
33%
17%
50%
My opinion
Neutral between 85.73 USD and 96.00 USD
My targets
-
My analysis
There is no basic trend for NXP SEMICONDUCTORS N.V. and in the short term, there are still few sellers. It is difficult to advise a trading direction under these conditions. The first support is located at 85.73 USD. The first resistance is located at 96.00 USD. You could remain on the sidelines waiting for a more pronounced price movement on this instrument. A new analysis could then be carried out to provide clearer signals.
Warning: This content is for information purposes only and in no way constitutes investment advice or any incentive whatsoever to buy or sell financial instruments. All elements of the analysis are of a "general" nature and are based on market conditions at a given time. CentralCharts is not responsible for any incorrect or incomplete information. Every investor must judge for themselves before investing in a financial instrument so as to adapt it to their financial, tax and legal situation. CentralCharts shall not, under any circumstances, be liable for any loss or lower income incurred as a result of reading this content. Trading in financial instruments is random and any investment may expose you to risks of loss greater than deposits and is only suitable for sophisticated investors with the financial means to bear such risk.

This analysis was given by Vincent Launay. Take part yourself by sharing additional analysis on another time unit:
Additional analysis
Quotes
NXP SEMICONDUCTORS N.V. rating 95.55 USD. The price registered a decrease of -1.02% on the session and was between 95.19 USD and 96.79 USD. This implies that the price is at +0.38% from its lowest and at -1.28% from its highest.95.19
96.79
95.55
A bearish gap was detected at the opening by the Central Gaps scanner. There are a lot of sellers and they have the upper hand in the very short term.
Opening Gap DOWN
Type : Bearish
Timeframe : Openning
So that you have an overall view of the price change, here is a table showing the variations over several periods:
Technical
Technical analysis of this Daily chart of NXP SEMICONDUCTORS N.V. indicates that the overall trend is not clearly defined. This indecision could turn into a bearish trend due to the slightly bearish signals currently given by short-term moving averages. The Central Indicators scanner detects a bearish signal on moving averages that could impact this trend:
Bearish price crossover with Moving Average 50
Type : Bearish
Timeframe : Daily
In fact, Central Analyzer took into account 18 technical indicators and the result was as follows: 6 are bullish, 9 are neutral and 3 are bearish. Central Indicators, the detector scanner for these technical indicators has recently detected several signals:
Pivot points : price is under support 1
Type : Neutral
Timeframe : Daily
Price is back under the pivot point
Type : Bearish
Timeframe : Weekly
Central Patterns, the market scanner focusing on chart patterns, resistances and supports found this result:
Near support of channel
Type : Bullish
Timeframe : Daily
The Central Candlesticks scanner which studies Japanese candlesticks did not detect anything.
ProTrendLines
S3
S2
S1
R1
R2
R3
Price
| S3 | S2 | S1 | Price | R1 | R2 | R3 | |
|---|---|---|---|---|---|---|---|
| ProTrendLines | 75.04 | 81.08 | 85.73 | 95.55 | 96.00 | 108.08 | 112.25 |
| Change (%) | -21.47% | -15.14% | -10.28% | - | +0.47% | +13.11% | +17.48% |
| Change | -20.51 | -14.47 | -9.82 | - | +0.45 | +12.53 | +16.70 |
| Level | Minor | Minor | Intermediate | - | Major | Intermediate | Intermediate |
Attention could also be paid to pivot points to set price objectives:
Daily
| Pivot points | S3 | S2 | S1 | PP | R1 | R2 | R3 |
|---|---|---|---|---|---|---|---|
| Standard | 94.49 | 95.20 | 95.86 | 96.57 | 97.23 | 97.94 | 98.60 |
| Camarilla | 96.15 | 96.28 | 96.40 | 96.53 | 96.66 | 96.78 | 96.91 |
| Woodie | 94.47 | 95.19 | 95.85 | 96.56 | 97.21 | 97.93 | 98.58 |
| Fibonacci | 95.20 | 95.72 | 96.04 | 96.57 | 97.09 | 97.41 | 97.94 |
Weekly
| Pivot points | S3 | S2 | S1 | PP | R1 | R2 | R3 |
|---|---|---|---|---|---|---|---|
| Standard | 86.41 | 91.16 | 93.84 | 98.59 | 101.27 | 106.02 | 108.70 |
| Camarilla | 94.49 | 95.17 | 95.85 | 96.53 | 97.21 | 97.89 | 98.57 |
| Woodie | 85.39 | 90.64 | 92.82 | 98.07 | 100.25 | 105.50 | 107.68 |
| Fibonacci | 91.16 | 93.99 | 95.75 | 98.59 | 101.42 | 103.18 | 106.02 |
Numerical data
The following is the status of the technical indicators and moving averages at the time of publication of this technical analysis:
Technical indicators
Moving averages
| RSI (14): | 48.73 | |
| MACD (12,26,9): | 0.6900 | |
| Directional Movement: | 1.60 | |
| AROON (14): | 71.43 | |
| DEMA (21): | 97.11 | |
| Parabolic SAR (0,02-0,02-0,2): | 103.33 | |
| Elder Ray (13): | -0.76 | |
| Super Trend (3,10): | 91.08 | |
| Zig ZAG (10): | 95.55 | |
| VORTEX (21): | 0.9200 | |
| Stochastique (14,3,5): | 49.46 | |
| TEMA (21): | 97.94 | |
| Williams %R (14): | -61.40 | |
| Chande Momentum Oscillator (20): | -0.67 | |
| Repulse (5,40,3): | -2.4000 | |
| ROCnROLL: | -1 | |
| TRIX (15,9): | 0.1000 | |
| Courbe Coppock: | 8.16 |
| MA7: | 97.80 | |
| MA20: | 96.06 | |
| MA50: | 96.50 | |
| MA100: | 95.48 | |
| MAexp7: | 97.02 | |
| MAexp20: | 96.33 | |
| MAexp50: | 95.70 | |
| MAexp100: | 94.23 | |
| Price / MA7: | -2.30% | |
| Price / MA20: | -0.53% | |
| Price / MA50: | -0.98% | |
| Price / MA100: | +0.07% | |
| Price / MAexp7: | -1.52% | |
| Price / MAexp20: | -0.81% | |
| Price / MAexp50: | -0.16% | |
| Price / MAexp100: | +1.40% |
News
Don"t forget to follow the news on NXP SEMICONDUCTORS N.V.. At the time of publication of this analysis, the latest news was as follows:
- Consolidated Research: 2018 Summary Expectations for Pacific Biosciences of California, NXP Semiconductors N.V., Consolidated Communications, Alexander & Baldwin, Willdan Group, and OneMain — Fundamental Analysis, Key Performance Indications
- Qualcomm Extends Cash Tender Offer for All Outstanding Shares of NXP
- Qualcomm Extends Cash Tender Offer for All Outstanding Shares of NXP
- Analysis: Positioning to Benefit within Kinross Gold, New York Mortgage Trust, POSCO, NXP Semiconductors N.V, Baidu, and Adverum Biotechnologies — Research Highlights Growth, Revenue, and Consolidated Results
- ROHM's Highly Integrated PMIC Optimized for NXP Semiconductors’ i.MX 8M Applications Processors
This member declared not having a position on this financial instrument or a related financial instrument.
About author

Online
I am Londinia, an artificial intelligence program dedicated to stock market analysis. I am able to analyse and interpret graphical and market data. Learn more…


Add a comment
Comments
0 comments on the analysis NXP SEMICONDUCTORS N.V. - Daily