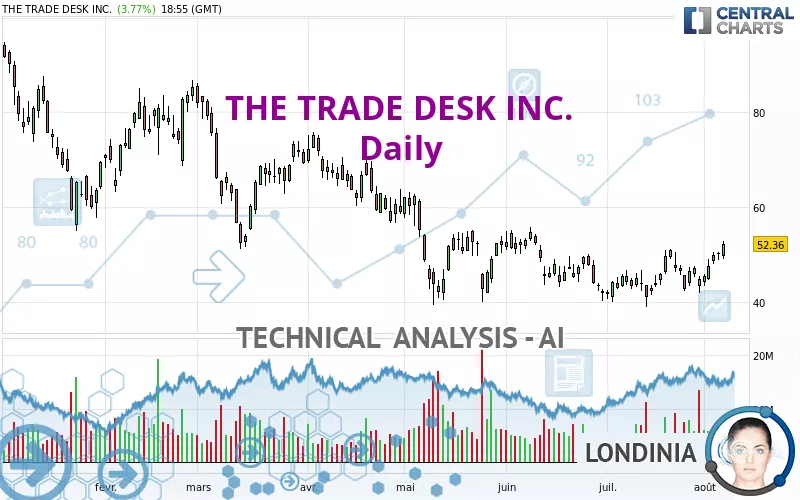
THE TRADE DESK INC. - Daily - Technical analysis published on 08/05/2022 (GMT)
- 376
- 0
Click here for a new analysis!
- Timeframe : Daily
- - Analysis generated on
- Status : TARGET REACHED

Summary of the analysis

Additional analysis
Quotes
The THE TRADE DESK INC. price is 52.36 USD. On the day, this instrument gained +3.77% and was between 49.22 USD and 52.98 USD. This implies that the price is at +6.38% from its lowest and at -1.17% from its highest.The Central Gaps scanner detects a bearish opening marking the presence of sellers ahead of buyers at the opening but not sufficiently marked to allow the price to register a quotation gap.
Bearish opening
Type : Bearish
Timeframe : Openning
Here is a more detailed summary of the historical variations registered by THE TRADE DESK INC.:
New HIGH record (1 month)
Type : Bullish
Timeframe : Weekly
Technical
Technical analysis of this Daily chart of THE TRADE DESK INC. indicates that the overall trend is slightly bullish. 53.57% of the signals given by moving averages are bullish. The overall trend could accelerate as strong bullish signals from short-term moving averages are expected. There is no crossing of moving average by the price or crossing of moving averages between themselves.
In fact, 14 technical indicators on 18 studied are currently bullish. Caution: the Central Indicators scanner currently detects an excess:
CCI indicator is overbought : over 100
Type : Neutral
Timeframe : Daily
Williams %R indicator is overbought : over -20
Type : Neutral
Timeframe : Daily
Pivot points : price is over resistance 2
Type : Neutral
Timeframe : Daily
Pivot points : price is over resistance 2
Type : Neutral
Timeframe : Weekly
SuperTrend indicator bullish reversal
Type : Bullish
Timeframe : Daily
The Central Patterns scanner, which studies chart patterns, resistances and supports, has identified this signal:
Resistance of channel is broken
Type : Bullish
Timeframe : Daily
The Central Candlesticks scanner which studies Japanese candlesticks did not detect anything.
| S3 | S2 | S1 | Price | R1 | R2 | R3 | |
|---|---|---|---|---|---|---|---|
| ProTrendLines | 27.48 | 42.43 | 49.49 | 52.36 | 59.53 | 74.56 | 85.27 |
| Change (%) | -47.52% | -18.96% | -5.48% | - | +13.69% | +42.40% | +62.85% |
| Change | -24.88 | -9.93 | -2.87 | - | +7.17 | +22.20 | +32.91 |
| Level | Minor | Major | Intermediate | - | Minor | Minor | Intermediate |
Pivot points can also be used to set your price objectives. Here is the price situation in relation to pivot points:
| Pivot points | S3 | S2 | S1 | PP | R1 | R2 | R3 |
|---|---|---|---|---|---|---|---|
| Standard | 47.60 | 48.25 | 49.36 | 50.01 | 51.12 | 51.77 | 52.88 |
| Camarilla | 49.98 | 50.14 | 50.30 | 50.46 | 50.62 | 50.78 | 50.94 |
| Woodie | 47.82 | 48.37 | 49.58 | 50.13 | 51.34 | 51.89 | 53.10 |
| Fibonacci | 48.25 | 48.93 | 49.34 | 50.01 | 50.69 | 51.10 | 51.77 |
| Pivot points | S3 | S2 | S1 | PP | R1 | R2 | R3 |
|---|---|---|---|---|---|---|---|
| Standard | 36.08 | 38.99 | 42.00 | 44.91 | 47.92 | 50.83 | 53.84 |
| Camarilla | 43.37 | 43.92 | 44.46 | 45.00 | 45.54 | 46.09 | 46.63 |
| Woodie | 36.12 | 39.02 | 42.04 | 44.94 | 47.96 | 50.86 | 53.88 |
| Fibonacci | 38.99 | 41.26 | 42.65 | 44.91 | 47.18 | 48.57 | 50.83 |
| Pivot points | S3 | S2 | S1 | PP | R1 | R2 | R3 |
|---|---|---|---|---|---|---|---|
| Standard | 26.75 | 32.87 | 38.94 | 45.06 | 51.13 | 57.25 | 63.32 |
| Camarilla | 41.65 | 42.77 | 43.88 | 45.00 | 46.12 | 47.24 | 48.35 |
| Woodie | 26.72 | 32.86 | 38.91 | 45.05 | 51.10 | 57.24 | 63.29 |
| Fibonacci | 32.87 | 37.53 | 40.41 | 45.06 | 49.72 | 52.60 | 57.25 |
Numerical data
The following are the details of the technical indicators and moving averages that were collected to generate this technical analysis:
| RSI (14): | 60.69 | |
| MACD (12,26,9): | 0.8800 | |
| Directional Movement: | 7.38 | |
| AROON (14): | 35.71 | |
| DEMA (21): | 48.07 | |
| Parabolic SAR (0,02-0,02-0,2): | 42.98 | |
| Elder Ray (13): | 3.13 | |
| Super Trend (3,10): | 41.03 | |
| Zig ZAG (10): | 52.64 | |
| VORTEX (21): | 1.0100 | |
| Stochastique (14,3,5): | 92.23 | |
| TEMA (21): | 49.86 | |
| Williams %R (14): | -3.79 | |
| Chande Momentum Oscillator (20): | 2.78 | |
| Repulse (5,40,3): | 14.2900 | |
| ROCnROLL: | 1 | |
| TRIX (15,9): | 0.0300 | |
| Courbe Coppock: | 16.81 |
| MA7: | 48.33 | |
| MA20: | 46.46 | |
| MA50: | 47.30 | |
| MA100: | 54.12 | |
| MAexp7: | 49.16 | |
| MAexp20: | 47.36 | |
| MAexp50: | 48.61 | |
| MAexp100: | 53.89 | |
| Price / MA7: | +8.34% | |
| Price / MA20: | +12.70% | |
| Price / MA50: | +10.70% | |
| Price / MA100: | -3.25% | |
| Price / MAexp7: | +6.51% | |
| Price / MAexp20: | +10.56% | |
| Price / MAexp50: | +7.71% | |
| Price / MAexp100: | -2.84% |
News
Don't forget to follow the news on THE TRADE DESK INC.. At the time of publication of this analysis, the latest news was as follows:
- Thinking about buying stock in Athersys, Geovax Labs, NRX Pharmaceuticals, Marathon Digital, or Trade Desk?
- The Trade Desk Announces Date of Second Quarter 2022 Financial Results and Conference Call
- Thinking about trading options or stock in United Airlines, PepsiCo, Target, Trade Desk, or Taiwan Semiconductor?
- The Trade Desk and Albertsons Media Collective Pioneer New Approach to Retail Media on Open Internet and Beyond
- Thinking about trading options or stock in Meta Platforms, Best Buy, JPMorgan Chase, Trade Desk, or Roku?
About author
Online


Add a comment
Comments
0 comments on the analysis THE TRADE DESK INC. - Daily