FIFTH THIRD BANCORP DEPOSITARY SHARE RE - 1H - Technical analysis published on 07/26/2024 (GMT)
- 192
- 0
Click here for a new analysis!
- Timeframe : 1H
- - Analysis generated on
- Status : INVALID
Summary of the analysis

Additional analysis
Quotes
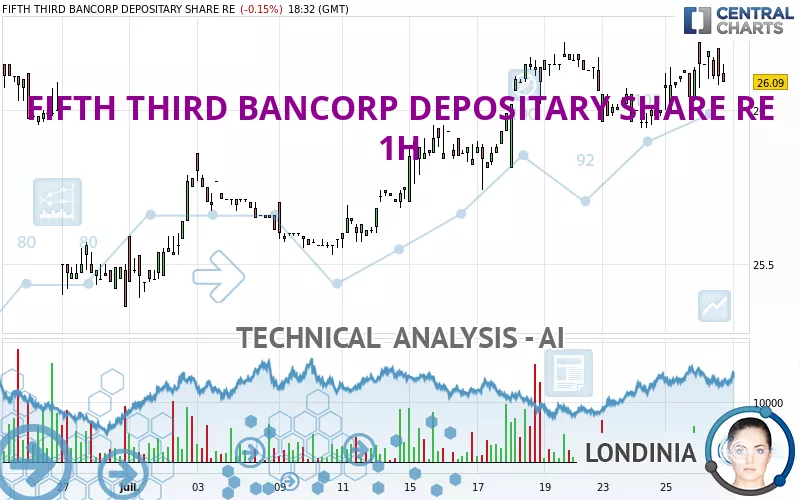
The FIFTH THIRD BANCORP DEPOSITARY SHARE RE rating is 26.11 USD. The price registered a decrease of -0.08% on the session and was traded between 26.07 USD and 26.22 USD over the period. The price is currently at +0.15% from its lowest and -0.42% from its highest.The Central Gaps scanner detects the formation of a bullish gap marking the strong presence of buyers against sellers at the opening. This formed a quotation gap.
Opening Gap UP
Type : Bullish
Timeframe : Openning
So that you have an overall view of the price change, here is a table showing the variations over several periods:
Near a new HIGH record (5 years)
Type : Bullish
Timeframe : Weekly
New HIGH record (1 year)
Type : Bullish
Timeframe : Weekly
New HIGH record (1st january)
Type : Bullish
Timeframe : Weekly
New HIGH record (1 month)
Type : Bullish
Timeframe : Weekly
Technical
Technical analysis of this 1H chart of FIFTH THIRD BANCORP DEPOSITARY SHARE RE indicates that the overall trend is strongly bullish. The signals given by moving averages are 85.71% bullish. This strongly bullish trend seems to be running out of steam given the signals being given by short-term moving averages. An assessment of moving averages reveals a bearish signal that could impact this trend:
Moving Average bearish crossovers : MA20 & MA50
Type : Bearish
Timeframe : 1 hour
Technical indicators are slightly bullish. There is therefore considerable uncertainty about the continuation of the increase.
Central Indicators, the detector scanner for these technical indicators recently detected a signal:
Williams %R indicator is back under -50
Type : Bearish
Timeframe : 1 hour
The Central Patterns scanner, which studies chart patterns, resistances and supports, has identified these signals:
Near horizontal resistance
Type : Bearish
Timeframe : 1 hour
Resistance of channel is broken
Type : Bullish
Timeframe : 1 hour
The Central Candlesticks scanner, specialised in Japanese candlesticks, did not identify any signals.
| S3 | S2 | S1 | Price | R1 | R2 | R3 | |
|---|---|---|---|---|---|---|---|
| ProTrendLines | 25.65 | 25.75 | 25.94 | 26.11 | 26.30 | 27.04 | 29.50 |
| Change (%) | -1.76% | -1.38% | -0.65% | - | +0.73% | +3.56% | +12.98% |
| Change | -0.46 | -0.36 | -0.17 | - | +0.19 | +0.93 | +3.39 |
| Level | Minor | Intermediate | Intermediate | - | Intermediate | Major | Intermediate |
Pivot points can also be used to set your price objectives. Here is the price situation in relation to pivot points:
| Pivot points | S3 | S2 | S1 | PP | R1 | R2 | R3 |
|---|---|---|---|---|---|---|---|
| Standard | 25.90 | 25.95 | 26.04 | 26.09 | 26.18 | 26.23 | 26.32 |
| Camarilla | 26.09 | 26.10 | 26.12 | 26.13 | 26.14 | 26.16 | 26.17 |
| Woodie | 25.92 | 25.96 | 26.06 | 26.10 | 26.20 | 26.24 | 26.34 |
| Fibonacci | 25.95 | 26.00 | 26.04 | 26.09 | 26.14 | 26.18 | 26.23 |
| Pivot points | S3 | S2 | S1 | PP | R1 | R2 | R3 |
|---|---|---|---|---|---|---|---|
| Standard | 25.33 | 25.51 | 25.85 | 26.03 | 26.37 | 26.55 | 26.89 |
| Camarilla | 26.04 | 26.09 | 26.13 | 26.18 | 26.23 | 26.28 | 26.32 |
| Woodie | 25.40 | 25.55 | 25.92 | 26.07 | 26.44 | 26.59 | 26.96 |
| Fibonacci | 25.51 | 25.71 | 25.84 | 26.03 | 26.23 | 26.36 | 26.55 |
| Pivot points | S3 | S2 | S1 | PP | R1 | R2 | R3 |
|---|---|---|---|---|---|---|---|
| Standard | 24.49 | 24.77 | 25.07 | 25.35 | 25.65 | 25.93 | 26.23 |
| Camarilla | 25.20 | 25.25 | 25.31 | 25.36 | 25.41 | 25.47 | 25.52 |
| Woodie | 24.49 | 24.78 | 25.07 | 25.36 | 25.65 | 25.94 | 26.23 |
| Fibonacci | 24.77 | 25.00 | 25.13 | 25.35 | 25.58 | 25.71 | 25.93 |
Numerical data
The following is the status of technical indicators and moving averages registered at the time this technical analysis was created:
| RSI (14): | 53.86 | |
| MACD (12,26,9): | 0.0300 | |
| Directional Movement: | 4.79 | |
| AROON (14): | 64.29 | |
| DEMA (21): | 26.12 | |
| Parabolic SAR (0,02-0,02-0,2): | 26.05 | |
| Elder Ray (13): | 0.02 | |
| Super Trend (3,10): | 25.96 | |
| Zig ZAG (10): | 26.11 | |
| VORTEX (21): | 1.0000 | |
| Stochastique (14,3,5): | 55.86 | |
| TEMA (21): | 26.13 | |
| Williams %R (14): | -45.83 | |
| Chande Momentum Oscillator (20): | 0.03 | |
| Repulse (5,40,3): | -0.3600 | |
| ROCnROLL: | 1 | |
| TRIX (15,9): | 0.0100 | |
| Courbe Coppock: | 0.95 |
| MA7: | 26.09 | |
| MA20: | 25.83 | |
| MA50: | 25.47 | |
| MA100: | 25.12 | |
| MAexp7: | 26.12 | |
| MAexp20: | 26.09 | |
| MAexp50: | 26.03 | |
| MAexp100: | 25.91 | |
| Price / MA7: | +0.08% | |
| Price / MA20: | +1.08% | |
| Price / MA50: | +2.51% | |
| Price / MA100: | +3.94% | |
| Price / MAexp7: | -0.04% | |
| Price / MAexp20: | +0.08% | |
| Price / MAexp50: | +0.31% | |
| Price / MAexp100: | +0.77% |
About author
Online


Add a comment
Comments
0 comments on the analysis FIFTH THIRD BANCORP DEPOSITARY SHARE RE - 1H