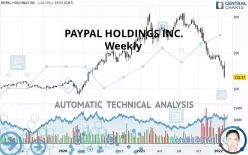
PAYPAL HOLDINGS INC. - Weekly - Technical analysis published on 02/02/2022 (GMT)
- 247
- 0
Click here for a new analysis!
- Timeframe : Weekly
- - Analysis generated on
- Status : TARGET REACHED

Summary of the analysis

Additional analysis
Quotes
The PAYPAL HOLDINGS INC. rating is 132.37 USD. The price registered a decrease of -15.68% over 5 days and was traded between 163.22 USD and 172.16 USD over the period. The price is currently at -18.90% from its lowest point and -23.11% from its highest point.The Central Gaps scanner detects a bearish gap which is a sign that the sellers have taken the lead in the very short term.
Opening Gap DOWN
Type : Bearish
Timeframe : Openning
So that you have an overall view of the price change, here is a table showing the variations over several periods:
New LOW record (1 year)
Type : Bearish
Timeframe : Weekly
New LOW record (1st january)
Type : Bearish
Timeframe : Weekly
New LOW record (1 month)
Type : Bearish
Timeframe : Weekly
Abnormal volumes on PAYPAL HOLDINGS INC. were detected by the Central Volumes scanner:
Abnormal volumes
Timeframe : 5 days
Technical
A technical analysis in Weekly of this PAYPAL HOLDINGS INC. chart shows a bearish trend. 75.00% of the signals given by moving averages are bearish. This bearish trend is supported by the strong bearish signals given by short-term moving averages. The Central Indicators scanner does not detect any result on moving averages that would impact this trend.
Technical indicators are strongly bearish, suggesting that the price decline is expected to continue.
Caution: the Central Indicators scanner currently detects an excess:
RSI indicator is oversold : under 20
Type : Neutral
Timeframe : Weekly
CCI indicator is oversold : under -100
Type : Neutral
Timeframe : Weekly
Williams %R indicator is oversold : under -80
Type : Neutral
Timeframe : Weekly
Pivot points : price is under support 3
Type : Neutral
Timeframe : Weekly
The Central Patterns scanner, which studies chart patterns, resistances and supports, has identified these signals:
Near horizontal support
Type : Bullish
Timeframe : Weekly
Support of channel is broken
Type : Bearish
Timeframe : Weekly
The presence of a bearish pattern in Japanese candlesticks detected by Central Candlesticks that could cause a correction in the very short term was also detected:
Bearish engulfing lines
Type : Bearish
Timeframe : Weekly
| S2 | S1 | Price | R1 | R2 | R3 | |
|---|---|---|---|---|---|---|
| ProTrendLines | 84.91 | 122.17 | 132.37 | 179.57 | 226.09 | 275.43 |
| Change (%) | -35.85% | -7.71% | - | +35.66% | +70.80% | +108.08% |
| Change | -47.46 | -10.20 | - | +47.20 | +93.72 | +143.06 |
| Level | Minor | Intermediate | - | Intermediate | Intermediate | Intermediate |
Attention could also be paid to pivot points to set price objectives:
| Pivot points | S3 | S2 | S1 | PP | R1 | R2 | R3 |
|---|---|---|---|---|---|---|---|
| Standard | 166.48 | 168.51 | 172.15 | 174.18 | 177.82 | 179.85 | 183.49 |
| Camarilla | 174.24 | 174.76 | 175.28 | 175.80 | 176.32 | 176.84 | 177.36 |
| Woodie | 167.30 | 168.91 | 172.97 | 174.58 | 178.64 | 180.25 | 184.31 |
| Fibonacci | 168.51 | 170.67 | 172.01 | 174.18 | 176.34 | 177.68 | 179.85 |
| Pivot points | S3 | S2 | S1 | PP | R1 | R2 | R3 |
|---|---|---|---|---|---|---|---|
| Standard | 142.04 | 147.06 | 155.29 | 160.31 | 168.54 | 173.56 | 181.79 |
| Camarilla | 159.88 | 161.09 | 162.31 | 163.52 | 164.74 | 165.95 | 167.16 |
| Woodie | 143.65 | 147.86 | 156.90 | 161.11 | 170.15 | 174.36 | 183.40 |
| Fibonacci | 147.06 | 152.12 | 155.25 | 160.31 | 165.37 | 168.50 | 173.56 |
| Pivot points | S3 | S2 | S1 | PP | R1 | R2 | R3 |
|---|---|---|---|---|---|---|---|
| Standard | 106.63 | 129.35 | 150.65 | 173.37 | 194.67 | 217.39 | 238.69 |
| Camarilla | 159.84 | 163.87 | 167.91 | 171.94 | 175.98 | 180.01 | 184.05 |
| Woodie | 105.91 | 129.00 | 149.93 | 173.02 | 193.95 | 217.04 | 237.97 |
| Fibonacci | 129.35 | 146.17 | 156.56 | 173.37 | 190.19 | 200.58 | 217.39 |
Numerical data
The following is the status of technical indicators and moving averages registered at the time this technical analysis was created:
| RSI (14): | 17.83 | |
| MACD (12,26,9): | -27.3400 | |
| Directional Movement: | -33.29 | |
| AROON (14): | -100.00 | |
| DEMA (21): | 165.99 | |
| Parabolic SAR (0,02-0,02-0,2): | 184.70 | |
| Elder Ray (13): | -30.94 | |
| Super Trend (3,10): | 204.25 | |
| Zig ZAG (10): | 130.95 | |
| VORTEX (21): | 0.5800 | |
| Stochastique (14,3,5): | 4.53 | |
| TEMA (21): | 146.30 | |
| Williams %R (14): | -97.90 | |
| Chande Momentum Oscillator (20): | -77.04 | |
| Repulse (5,40,3): | -42.2500 | |
| ROCnROLL: | 2 | |
| TRIX (15,9): | -1.3100 | |
| Courbe Coppock: | 61.68 |
| MA7: | 159.66 | |
| MA20: | 172.63 | |
| MA50: | 182.31 | |
| MA100: | 215.15 | |
| MAexp7: | 166.45 | |
| MAexp20: | 198.88 | |
| MAexp50: | 221.44 | |
| MAexp100: | 208.03 | |
| Price / MA7: | -17.09% | |
| Price / MA20: | -23.32% | |
| Price / MA50: | -27.39% | |
| Price / MA100: | -38.48% | |
| Price / MAexp7: | -20.47% | |
| Price / MAexp20: | -33.44% | |
| Price / MAexp50: | -40.22% | |
| Price / MAexp100: | -36.37% |
News
The latest news and videos published on PAYPAL HOLDINGS INC. at the time of the analysis were as follows:
- PayPal Reports Fourth Quarter and Full Year 2021 Results
-
 PayPal Downside Appears Limited by FX Empire
- SoLa Impact's Black Impact Fund Receives $25 Million Investment from PayPal to Address Racial Equity Through Affordable Housing
- Venmo Launches Gift-Wrapping Feature to Help its Community Celebrate Every Moment
- PAYPAL ALERT: Bragar Eagel & Squire, P.C. is Investigating PayPal Holdings, Inc. on Behalf of Long-Term Stockholders and Encourages Investors to Contact the Firm
About author

Online


Add a comment
Comments
0 comments on the analysis PAYPAL HOLDINGS INC. - Weekly