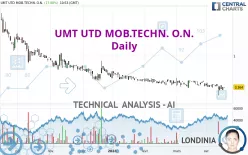
UMT UTD MOB.TECHN. O.N. - Daily - Technical analysis published on 04/18/2024 (GMT)
- 138
- 0
Click here for a new analysis!
- Timeframe : Daily
- - Analysis generated on
- Status : TARGET REACHED

Summary of the analysis

Additional analysis
Quotes
The UMT UTD MOB.TECHN. O.N. rating is 0.364 EUR. The price has increased by +17.80% since the last closing and was traded between 0.361 EUR and 0.364 EUR over the period. The price is currently at +0.83% from its lowest and 0% from its highest.The Central Gaps scanner detects a bullish opening marking the presence of buyers ahead of sellers at the opening but not sufficiently marked to allow the price to register a quotation gap.
Bullish opening
Type : Bullish
Timeframe : Openning
A study of price movements over other periods shows the following variations:
Technical
A technical analysis in Daily of this UMT UTD MOB.TECHN. O.N. chart shows a sharp bearish trend. 92.86% of the signals given by moving averages are bearish. This strongly bearish trend is supported by the strong bearish signals given by short-term moving averages. The Central Indicators market scanner currently does not detect any result that concerns moving averages.
An assessment of technical indicators does not currently provide any relevant information on the direction of future price movements.
But beware of excesses. The Central Indicators scanner currently detects this:
Previous candle closed under Bollinger bands
Type : Neutral
Timeframe : Daily
CCI indicator: bullish divergence
Type : Bullish
Timeframe : Daily
Pivot points : price is over resistance 1
Type : Neutral
Timeframe : Daily
Price is back over the pivot point
Type : Bullish
Timeframe : Weekly
Williams %R indicator is back over -50
Type : Bullish
Timeframe : Daily
No signals are given by Central Patterns, a market scanner specialised in chart patterns, resistances and supports.
The Central Candlesticks scanner currently notes the presence of this pattern in Japanese candlesticks that could mark the end of the short-term trend currently underway:
Doji
Type : Neutral
Timeframe : Daily
| Price | R1 | R2 | R3 | |
|---|---|---|---|---|
| ProTrendLines | 0.364 | 0.524 | 0.745 | 1.020 |
| Change (%) | - | +43.96% | +104.67% | +180.22% |
| Change | - | +0.160 | +0.381 | +0.656 |
| Level | - | Minor | Minor | Minor |
Attention could also be paid to pivot points to set price objectives:
| Pivot points | S3 | S2 | S1 | PP | R1 | R2 | R3 |
|---|---|---|---|---|---|---|---|
| Standard | 0.229 | 0.267 | 0.288 | 0.326 | 0.347 | 0.385 | 0.406 |
| Camarilla | 0.293 | 0.298 | 0.304 | 0.309 | 0.314 | 0.320 | 0.325 |
| Woodie | 0.221 | 0.263 | 0.280 | 0.322 | 0.339 | 0.381 | 0.398 |
| Fibonacci | 0.267 | 0.290 | 0.304 | 0.326 | 0.349 | 0.363 | 0.385 |
| Pivot points | S3 | S2 | S1 | PP | R1 | R2 | R3 |
|---|---|---|---|---|---|---|---|
| Standard | -0.005 | 0.097 | 0.224 | 0.326 | 0.453 | 0.555 | 0.682 |
| Camarilla | 0.287 | 0.308 | 0.329 | 0.350 | 0.371 | 0.392 | 0.413 |
| Woodie | 0.007 | 0.103 | 0.236 | 0.332 | 0.465 | 0.561 | 0.694 |
| Fibonacci | 0.097 | 0.185 | 0.239 | 0.326 | 0.414 | 0.468 | 0.555 |
| Pivot points | S3 | S2 | S1 | PP | R1 | R2 | R3 |
|---|---|---|---|---|---|---|---|
| Standard | 0.106 | 0.228 | 0.306 | 0.428 | 0.506 | 0.628 | 0.706 |
| Camarilla | 0.329 | 0.347 | 0.366 | 0.384 | 0.402 | 0.421 | 0.439 |
| Woodie | 0.084 | 0.217 | 0.284 | 0.417 | 0.484 | 0.617 | 0.684 |
| Fibonacci | 0.228 | 0.304 | 0.352 | 0.428 | 0.504 | 0.552 | 0.628 |
Numerical data
The following is the status of technical indicators and moving averages registered at the time this technical analysis was created:
| RSI (14): | 44.05 | |
| MACD (12,26,9): | -0.0300 | |
| Directional Movement: | -25.918 | |
| AROON (14): | -71.429 | |
| DEMA (21): | 0.354 | |
| Parabolic SAR (0,02-0,02-0,2): | 0.437 | |
| Elder Ray (13): | -0.013 | |
| Super Trend (3,10): | 0.478 | |
| Zig ZAG (10): | 0.364 | |
| VORTEX (21): | 0.8510 | |
| Stochastique (14,3,5): | 48.68 | |
| TEMA (21): | 0.344 | |
| Williams %R (14): | -34.66 | |
| Chande Momentum Oscillator (20): | -0.047 | |
| Repulse (5,40,3): | -19.1400 | |
| ROCnROLL: | 2 | |
| TRIX (15,9): | -0.7600 | |
| Courbe Coppock: | 35.53 |
| MA7: | 0.355 | |
| MA20: | 0.399 | |
| MA50: | 0.439 | |
| MA100: | 0.527 | |
| MAexp7: | 0.357 | |
| MAexp20: | 0.391 | |
| MAexp50: | 0.448 | |
| MAexp100: | 0.615 | |
| Price / MA7: | +2.54% | |
| Price / MA20: | -8.77% | |
| Price / MA50: | -17.08% | |
| Price / MA100: | -30.93% | |
| Price / MAexp7: | +1.96% | |
| Price / MAexp20: | -6.91% | |
| Price / MAexp50: | -18.75% | |
| Price / MAexp100: | -40.81% |
News
The latest news and videos published on UMT UTD MOB.TECHN. O.N. at the time of the analysis were as follows:
- EQS-News: Alexander Hupe will be appointed to the Management Board as of June 01, 2023, and, as CFO, will be responsible in particular for Finance & M&A
- EQS-Adhoc: UMT AG announces change in the Management Board – Alexander Hupe to be newly appointed to the Management Board as of June 01, 2023, and, as CFO, responsible in particular for Finance & M&A
- EQS-News: UMT United Mobility Technology AG: UMT AG intends to acquire an AI-based DMS to build up a new business area
- EQS-News: UMT AG announces cooperation with capital market and M&A expert Alexander Hupe
- EQS-Adhoc: UMT AG: Research project 'Sunrise' of the Federal Ministry of Education and Research has been launched – 'Buy-and-Build' strategy of UMT AG shows promising development
About author
Online


Add a comment
Comments
0 comments on the analysis UMT UTD MOB.TECHN. O.N. - Daily