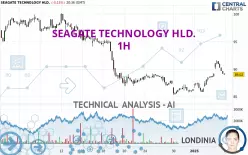
SEAGATE TECHNOLOGY HLD. - 1H - Technical analysis published on 01/06/2025 (GMT)
- 119
- 0
Click here for a new analysis!
- Timeframe : 1H
- - Analysis generated on
- Status : LEVEL MAINTAINED

Summary of the analysis

Additional analysis
Quotes
The SEAGATE TECHNOLOGY HLD. rating is 89.02 USD. The price is lower by -0.15% since the last closing and was between 88.96 USD and 91.59 USD. This implies that the price is at +0.07% from its lowest and at -2.81% from its highest.A bullish gap was detected at the opening by the Central Gaps scanner. There are a lot of buyers and they have the upper hand in the very short term.
Opening Gap UP
Type : Bullish
Timeframe : Openning
Here is a more detailed summary of the historical variations registered by SEAGATE TECHNOLOGY HLD.:
New HIGH record (1st january)
Type : Bullish
Timeframe : Weekly
Near a new LOW record (1 month)
Type : Bearish
Timeframe : Weekly
Technical
Technical analysis of SEAGATE TECHNOLOGY HLD. in 1H shows a neutral overall trend. The trend could quickly turn bullish due to the strong bullish signals currently being given by short-term moving averages. There is no crossing of moving average by the price or crossing of moving averages between themselves.
An assessment of technical indicators shows a moderate bullish signal.
Other results related to technical indicators were also found by the Central Indicators scanner:
SuperTrend indicator bearish reversal
Type : Bearish
Timeframe : 1 hour
Williams %R indicator is back under -50
Type : Bearish
Timeframe : 1 hour
An analysis of the price chart with the Central Patterns scanner (detector of chart patterns and resistances and supports) shows several results that can have an impact on the price change:
Near horizontal resistance
Type : Bearish
Timeframe : 1 hour
Resistance of channel is broken
Type : Bullish
Timeframe : 1 hour
The Central Candlesticks scanner which studies Japanese candlesticks did not detect anything.
| S3 | S2 | S1 | Price | R1 | R2 | R3 | |
|---|---|---|---|---|---|---|---|
| ProTrendLines | 82.78 | 85.25 | 86.89 | 89.02 | 89.20 | 91.73 | 94.20 |
| Change (%) | -7.01% | -4.24% | -2.39% | - | +0.20% | +3.04% | +5.82% |
| Change | -6.24 | -3.77 | -2.13 | - | +0.18 | +2.71 | +5.18 |
| Level | Major | Minor | Intermediate | - | Minor | Major | Intermediate |
Attention could also be paid to pivot points to set price objectives:
| Pivot points | S3 | S2 | S1 | PP | R1 | R2 | R3 |
|---|---|---|---|---|---|---|---|
| Standard | 85.18 | 85.98 | 87.57 | 88.37 | 89.96 | 90.76 | 92.35 |
| Camarilla | 88.49 | 88.71 | 88.93 | 89.15 | 89.37 | 89.59 | 89.81 |
| Woodie | 85.57 | 86.18 | 87.96 | 88.57 | 90.35 | 90.96 | 92.74 |
| Fibonacci | 85.98 | 86.90 | 87.46 | 88.37 | 89.29 | 89.85 | 90.76 |
| Pivot points | S3 | S2 | S1 | PP | R1 | R2 | R3 |
|---|---|---|---|---|---|---|---|
| Standard | 82.61 | 83.93 | 86.54 | 87.86 | 90.47 | 91.79 | 94.40 |
| Camarilla | 88.07 | 88.43 | 88.79 | 89.15 | 89.51 | 89.87 | 90.23 |
| Woodie | 83.26 | 84.25 | 87.19 | 88.18 | 91.12 | 92.11 | 95.05 |
| Fibonacci | 83.93 | 85.43 | 86.36 | 87.86 | 89.36 | 90.29 | 91.79 |
| Pivot points | S3 | S2 | S1 | PP | R1 | R2 | R3 |
|---|---|---|---|---|---|---|---|
| Standard | 60.50 | 72.88 | 79.59 | 91.97 | 98.68 | 111.06 | 117.77 |
| Camarilla | 81.06 | 82.81 | 84.56 | 86.31 | 88.06 | 89.81 | 91.56 |
| Woodie | 57.68 | 71.46 | 76.77 | 90.55 | 95.86 | 109.64 | 114.95 |
| Fibonacci | 72.88 | 80.17 | 84.67 | 91.97 | 99.26 | 103.76 | 111.06 |
Numerical data
The following is the status of technical indicators and moving averages registered at the time this technical analysis was created:
| RSI (14): | 55.92 | |
| MACD (12,26,9): | 0.8200 | |
| Directional Movement: | 12.30 | |
| AROON (14): | 71.43 | |
| DEMA (21): | 89.76 | |
| Parabolic SAR (0,02-0,02-0,2): | 91.59 | |
| Elder Ray (13): | 0.10 | |
| Super Trend (3,10): | 89.01 | |
| Zig ZAG (10): | 89.26 | |
| VORTEX (21): | 1.1100 | |
| Stochastique (14,3,5): | 68.11 | |
| TEMA (21): | 90.56 | |
| Williams %R (14): | -41.29 | |
| Chande Momentum Oscillator (20): | 1.83 | |
| Repulse (5,40,3): | -1.4100 | |
| ROCnROLL: | -1 | |
| TRIX (15,9): | 0.1100 | |
| Courbe Coppock: | 7.55 |
| MA7: | 87.61 | |
| MA20: | 91.51 | |
| MA50: | 96.40 | |
| MA100: | 100.13 | |
| MAexp7: | 89.74 | |
| MAexp20: | 88.82 | |
| MAexp50: | 88.50 | |
| MAexp100: | 89.95 | |
| Price / MA7: | +1.61% | |
| Price / MA20: | -2.72% | |
| Price / MA50: | -7.66% | |
| Price / MA100: | -11.10% | |
| Price / MAexp7: | -0.80% | |
| Price / MAexp20: | +0.23% | |
| Price / MAexp50: | +0.59% | |
| Price / MAexp100: | -1.03% |
News
Don't forget to follow the news on SEAGATE TECHNOLOGY HLD.. At the time of publication of this analysis, the latest news was as follows:
- Seagate to Participate in Upcoming Investor Events
- Seagate Federal and KLC Group Announce Strategic Partnership for NSA CSfC Data-at-Rest Solutions
- OORT Collaborates with Seagate Lyve Services to Strengthen AI-Focused Decentralized Cloud Services
- SHAREHOLDER ALERT: Levi & Korsinsky Notifies Seagate Technology Holdings plc(STX) Investors of a Class Action Lawsuit and Upcoming Deadline
- STX Investors Have Opportunity to Lead Seagate Technology Holdings plc Securities Fraud Lawsuit
About author
Online


Add a comment
Comments
0 comments on the analysis SEAGATE TECHNOLOGY HLD. - 1H