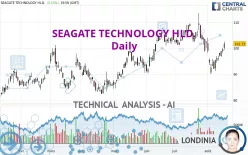
SEAGATE TECHNOLOGY HLD. - Daily - Technical analysis published on 08/19/2024 (GMT)
- 159
- 0
Click here for a new analysis!
- Timeframe : Daily
- - Analysis generated on
- Status : TARGET REACHED

Summary of the analysis

Additional analysis
Quotes
The SEAGATE TECHNOLOGY HLD. rating is 101.73 USD. The price registered an increase of +2.13% on the session and was traded between 99.36 USD and 102.57 USD over the period. The price is currently at +2.39% from its lowest and -0.82% from its highest.The Central Gaps scanner detects a bullish gap which is a sign that buyers have taken the lead in the very short term.
Opening Gap UP
Type : Bullish
Timeframe : Openning
So that you have an overall view of the price change, here is a table showing the variations over several periods:
Technical
A technical analysis in Daily of this SEAGATE TECHNOLOGY HLD. chart shows a bullish trend. 75.00% of the signals given by moving averages are bullish. The overall trend seems to be showing some signs of weakness, as do the tentative bullish signals given by short-term moving averages. An assessment of moving averages reveals several bullish signals that could impact this trend:
Bullish trend reversal : adaptative moving average 20
Type : Bullish
Timeframe : Daily
Bullish trend reversal : adaptative moving average 50
Type : Bullish
Timeframe : Daily
Bullish price crossover with adaptative moving average 20
Type : Bullish
Timeframe : Daily
Bullish price crossover with adaptative moving average 50
Type : Bullish
Timeframe : Daily
The probability of a further increase are moderate given the direction of the technical indicators.
Caution: the Central Indicators scanner currently detects an excess:
Williams %R indicator is overbought : over -20
Type : Neutral
Timeframe : Daily
Pivot points : price is over resistance 2
Type : Neutral
Timeframe : Daily
Pivot points : price is over resistance 2
Type : Neutral
Timeframe : Weekly
Ichimoku : price is over the cloud
Type : Bullish
Timeframe : Daily
Momentum indicator is back under 0
Type : Bearish
Timeframe : Daily
The Central Patterns scanner, which studies chart patterns, resistances and supports, has identified this signal:
Near resistance of channel
Type : Bearish
Timeframe : Daily
No result was found by the Central Candlesticks scanner on Japanese candlesticks.
| S3 | S2 | S1 | Price | R1 | R2 | |
|---|---|---|---|---|---|---|
| ProTrendLines | 93.04 | 97.18 | 101.37 | 101.73 | 105.10 | 109.53 |
| Change (%) | -8.54% | -4.47% | -0.35% | - | +3.31% | +7.67% |
| Change | -8.69 | -4.55 | -0.36 | - | +3.37 | +7.80 |
| Level | Major | Major | Major | - | Major | Major |
Pivot points can also be used to set your price objectives. Here is the price situation in relation to pivot points:
| Pivot points | S3 | S2 | S1 | PP | R1 | R2 | R3 |
|---|---|---|---|---|---|---|---|
| Standard | 96.66 | 98.01 | 99.87 | 101.22 | 103.08 | 104.43 | 106.29 |
| Camarilla | 100.85 | 101.14 | 101.44 | 101.73 | 102.02 | 102.32 | 102.61 |
| Woodie | 96.92 | 98.14 | 100.13 | 101.35 | 103.34 | 104.56 | 106.55 |
| Fibonacci | 98.01 | 99.24 | 99.99 | 101.22 | 102.45 | 103.20 | 104.43 |
| Pivot points | S3 | S2 | S1 | PP | R1 | R2 | R3 |
|---|---|---|---|---|---|---|---|
| Standard | 84.87 | 87.43 | 91.86 | 94.42 | 98.85 | 101.41 | 105.84 |
| Camarilla | 94.36 | 95.00 | 95.64 | 96.28 | 96.92 | 97.56 | 98.20 |
| Woodie | 85.80 | 87.90 | 92.79 | 94.89 | 99.78 | 101.88 | 106.77 |
| Fibonacci | 87.43 | 90.10 | 91.75 | 94.42 | 97.09 | 98.74 | 101.41 |
| Pivot points | S3 | S2 | S1 | PP | R1 | R2 | R3 |
|---|---|---|---|---|---|---|---|
| Standard | 81.09 | 89.86 | 96.02 | 104.79 | 110.95 | 119.72 | 125.88 |
| Camarilla | 98.06 | 99.43 | 100.80 | 102.17 | 103.54 | 104.91 | 106.28 |
| Woodie | 79.78 | 89.21 | 94.71 | 104.14 | 109.64 | 119.07 | 124.57 |
| Fibonacci | 89.86 | 95.57 | 99.09 | 104.79 | 110.50 | 114.02 | 119.72 |
Numerical data
The following are the details of the technical indicators and moving averages that were collected to generate this technical analysis:
| RSI (14): | 54.30 | |
| MACD (12,26,9): | -1.1300 | |
| Directional Movement: | 2.13 | |
| AROON (14): | -35.71 | |
| DEMA (21): | 97.51 | |
| Parabolic SAR (0,02-0,02-0,2): | 90.58 | |
| Elder Ray (13): | 2.57 | |
| Super Trend (3,10): | 103.96 | |
| Zig ZAG (10): | 101.73 | |
| VORTEX (21): | 0.8800 | |
| Stochastique (14,3,5): | 65.03 | |
| TEMA (21): | 96.37 | |
| Williams %R (14): | -16.93 | |
| Chande Momentum Oscillator (20): | -0.44 | |
| Repulse (5,40,3): | 2.4300 | |
| ROCnROLL: | 1 | |
| TRIX (15,9): | -0.2400 | |
| Courbe Coppock: | 11.38 |
| MA7: | 97.74 | |
| MA20: | 99.47 | |
| MA50: | 101.77 | |
| MA100: | 95.84 | |
| MAexp7: | 98.45 | |
| MAexp20: | 99.05 | |
| MAexp50: | 99.33 | |
| MAexp100: | 96.13 | |
| Price / MA7: | +4.08% | |
| Price / MA20: | +2.27% | |
| Price / MA50: | -0.04% | |
| Price / MA100: | +6.15% | |
| Price / MAexp7: | +3.33% | |
| Price / MAexp20: | +2.71% | |
| Price / MAexp50: | +2.42% | |
| Price / MAexp100: | +5.83% |
News
The last news published on SEAGATE TECHNOLOGY HLD. at the time of the generation of this analysis was as follows:
- Seagate Federal and KLC Group Announce Strategic Partnership for NSA CSfC Data-at-Rest Solutions
- OORT Collaborates with Seagate Lyve Services to Strengthen AI-Focused Decentralized Cloud Services
- SHAREHOLDER ALERT: Levi & Korsinsky Notifies Seagate Technology Holdings plc(STX) Investors of a Class Action Lawsuit and Upcoming Deadline
- STX Investors Have Opportunity to Lead Seagate Technology Holdings plc Securities Fraud Lawsuit
- SHAREHOLDER ALERT: The Gross Law Firm Notifies Shareholders of Seagate Technology Holdings plc of a Class Action Lawsuit and a Lead Plaintiff Deadline of September 8, 2023 - (NASDAQ: STX)
About author

Online


Add a comment
Comments
0 comments on the analysis SEAGATE TECHNOLOGY HLD. - Daily