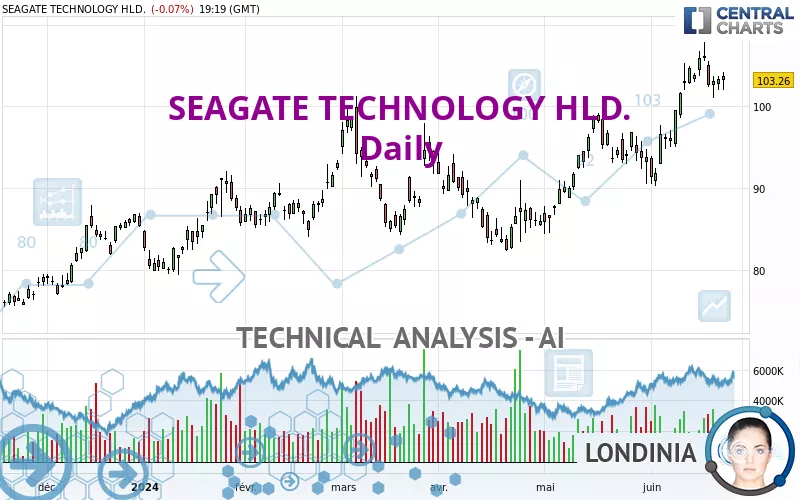
SEAGATE TECHNOLOGY HLD. - Daily - Technical analysis published on 06/25/2024 (GMT)
- 241
- 0
Click here for a new analysis!
- Timeframe : Daily
- - Analysis generated on
- Status : TARGET REACHED
Summary of the analysis

Additional analysis
Quotes
The SEAGATE TECHNOLOGY HLD. rating is 103.26 USD. On the day, this instrument lost -0.07% and was between 102.00 USD and 104.19 USD. This implies that the price is at +1.24% from its lowest and at -0.89% from its highest.The Central Gaps scanner detects a bullish opening marking the presence of buyers ahead of sellers at the opening but not sufficiently marked to allow the price to register a quotation gap.
Bullish opening
Type : Bullish
Timeframe : Openning
So that you have an overall view of the price change, here is a table showing the variations over several periods:
Near a new HIGH record (5 years)
Type : Bullish
Timeframe : Weekly
Near a new HIGH record (1 year)
Type : Bullish
Timeframe : Weekly
Near a new HIGH record (1st january)
Type : Bullish
Timeframe : Weekly
Near a new HIGH record (1 month)
Type : Bullish
Timeframe : Weekly
Technical
A technical analysis in Daily of this SEAGATE TECHNOLOGY HLD. chart shows a strongly bullish trend. 92.86% of the signals given by moving averages are bullish. The overall trend is supported by the strong bullish signals from short-term moving averages. The Central Indicators scanner does not detect any result on moving averages that would impact this trend.
An assessment of technical indicators shows a strong bullish signal.
Central Indicators, the detector scanner for these technical indicators recently detected a signal:
Price is back under the pivot point
Type : Bearish
Timeframe : Daily
The Central Patterns scanner, which studies chart patterns, resistances and supports, has identified this signal:
Near horizontal resistance
Type : Bearish
Timeframe : Daily
The Central Candlesticks scanner, specialised in Japanese candlesticks, did not identify any signals.
| S3 | S2 | S1 | Price | R1 | |
|---|---|---|---|---|---|
| ProTrendLines | 81.92 | 93.04 | 97.18 | 103.26 | 105.10 |
| Change (%) | -20.67% | -9.90% | -5.89% | - | +1.78% |
| Change | -21.34 | -10.22 | -6.08 | - | +1.84 |
| Level | Intermediate | Major | Major | - | Major |
To determine price objectives, it is also possible to use the pivot points. Here is the price position in relation to pivot points:
| Pivot points | S3 | S2 | S1 | PP | R1 | R2 | R3 |
|---|---|---|---|---|---|---|---|
| Standard | 100.62 | 101.33 | 102.33 | 103.04 | 104.04 | 104.75 | 105.75 |
| Camarilla | 102.86 | 103.02 | 103.17 | 103.33 | 103.49 | 103.64 | 103.80 |
| Woodie | 100.77 | 101.40 | 102.48 | 103.11 | 104.19 | 104.82 | 105.90 |
| Fibonacci | 101.33 | 101.98 | 102.39 | 103.04 | 103.69 | 104.10 | 104.75 |
| Pivot points | S3 | S2 | S1 | PP | R1 | R2 | R3 |
|---|---|---|---|---|---|---|---|
| Standard | 94.14 | 97.57 | 100.33 | 103.76 | 106.52 | 109.95 | 112.71 |
| Camarilla | 101.38 | 101.95 | 102.51 | 103.08 | 103.65 | 104.22 | 104.78 |
| Woodie | 93.80 | 97.40 | 99.99 | 103.59 | 106.18 | 109.78 | 112.37 |
| Fibonacci | 97.57 | 99.94 | 101.40 | 103.76 | 106.13 | 107.59 | 109.95 |
| Pivot points | S3 | S2 | S1 | PP | R1 | R2 | R3 |
|---|---|---|---|---|---|---|---|
| Standard | 69.99 | 76.89 | 84.75 | 91.65 | 99.51 | 106.41 | 114.27 |
| Camarilla | 88.56 | 89.91 | 91.27 | 92.62 | 93.97 | 95.33 | 96.68 |
| Woodie | 70.48 | 77.13 | 85.24 | 91.89 | 100.00 | 106.65 | 114.76 |
| Fibonacci | 76.89 | 82.53 | 86.01 | 91.65 | 97.29 | 100.77 | 106.41 |
Numerical data
The following is the status of the technical indicators and moving averages at the time of publication of this technical analysis:
| RSI (14): | 63.44 | |
| MACD (12,26,9): | 3.1300 | |
| Directional Movement: | 17.57 | |
| AROON (14): | 71.43 | |
| DEMA (21): | 103.88 | |
| Parabolic SAR (0,02-0,02-0,2): | 99.99 | |
| Elder Ray (13): | 1.60 | |
| Super Trend (3,10): | 97.39 | |
| Zig ZAG (10): | 103.10 | |
| VORTEX (21): | 1.1100 | |
| Stochastique (14,3,5): | 75.59 | |
| TEMA (21): | 105.02 | |
| Williams %R (14): | -27.68 | |
| Chande Momentum Oscillator (20): | 7.77 | |
| Repulse (5,40,3): | 0.2400 | |
| ROCnROLL: | 1 | |
| TRIX (15,9): | 0.4600 | |
| Courbe Coppock: | 21.93 |
| MA7: | 103.70 | |
| MA20: | 98.81 | |
| MA50: | 92.98 | |
| MA100: | 90.76 | |
| MAexp7: | 102.94 | |
| MAexp20: | 99.83 | |
| MAexp50: | 95.26 | |
| MAexp100: | 90.77 | |
| Price / MA7: | -0.42% | |
| Price / MA20: | +4.50% | |
| Price / MA50: | +11.06% | |
| Price / MA100: | +13.77% | |
| Price / MAexp7: | +0.31% | |
| Price / MAexp20: | +3.44% | |
| Price / MAexp50: | +8.40% | |
| Price / MAexp100: | +13.76% |
News
The last news published on SEAGATE TECHNOLOGY HLD. at the time of the generation of this analysis was as follows:
- Seagate Federal and KLC Group Announce Strategic Partnership for NSA CSfC Data-at-Rest Solutions
- OORT Collaborates with Seagate Lyve Services to Strengthen AI-Focused Decentralized Cloud Services
- SHAREHOLDER ALERT: Levi & Korsinsky Notifies Seagate Technology Holdings plc(STX) Investors of a Class Action Lawsuit and Upcoming Deadline
- STX Investors Have Opportunity to Lead Seagate Technology Holdings plc Securities Fraud Lawsuit
- SHAREHOLDER ALERT: The Gross Law Firm Notifies Shareholders of Seagate Technology Holdings plc of a Class Action Lawsuit and a Lead Plaintiff Deadline of September 8, 2023 - (NASDAQ: STX)
About author
Online


Add a comment
Comments
0 comments on the analysis SEAGATE TECHNOLOGY HLD. - Daily