SEAGATE TECHNOLOGY HLD. - 1H - Technical analysis published on 06/18/2024 (GMT)
- 197
- 0
Click here for a new analysis!
- Timeframe : 1H
- - Analysis generated on
- Status : LEVEL MAINTAINED
Summary of the analysis

Additional analysis
Quotes
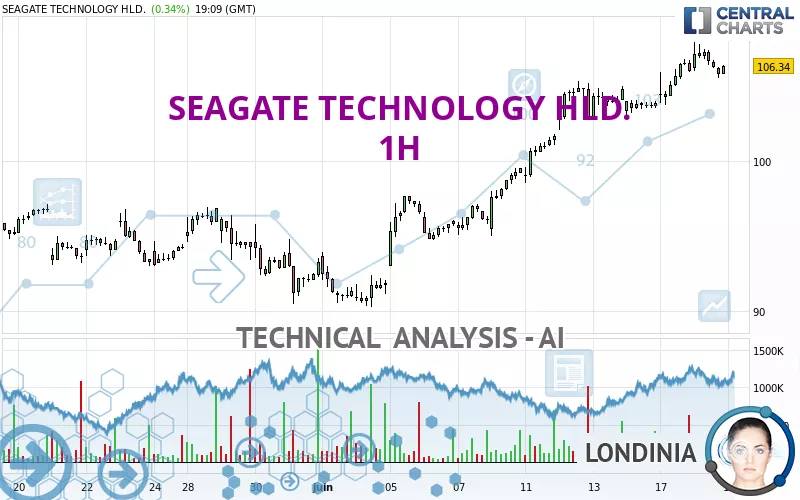
The SEAGATE TECHNOLOGY HLD. price is 105.91 USD. On the day, this instrument lost -0.07% and was traded between 105.52 USD and 107.91 USD over the period. The price is currently at +0.37% from its lowest and -1.85% from its highest.Here is a more detailed summary of the historical variations registered by SEAGATE TECHNOLOGY HLD.:
New HIGH record (5 years)
Type : Bullish
Timeframe : Weekly
New HIGH record (1 year)
Type : Bullish
Timeframe : Weekly
New HIGH record (1st january)
Type : Bullish
Timeframe : Weekly
New HIGH record (1 month)
Type : Bullish
Timeframe : Weekly
Technical
Technical analysis of SEAGATE TECHNOLOGY HLD. in 1H shows a strongly overall bullish trend. 92.86% of the signals given by moving averages are bullish. The overall trend is supported by the strong bullish signals from short-term moving averages. The Central Indicators market scanner is currently detecting a bearish signal that could impact this trend:
Bearish price crossover with adaptative moving average 50
Type : Bearish
Timeframe : 1 hour
In fact, of the 18 technical indicators analysed by Central Analyzer, 5 are bullish, 9 are neutral and 4 are bearish. Other results related to technical indicators were also found by the Central Indicators scanner:
Parabolic SAR indicator bearish reversal
Type : Bearish
Timeframe : 1 hour
Williams %R indicator is back under -50
Type : Bearish
Timeframe : 1 hour
The Central Patterns scanner, which studies chart patterns, resistances and supports, has identified this signal:
Near horizontal resistance
Type : Bearish
Timeframe : 1 hour
Central Candlesticks, the scanner specialised in Japanese candlesticks, detects a bullish signal that could support the hypothesis of a small rebound in the very short term:
Bullish harami
Type : Bullish
Timeframe : 1 hour
| S3 | S2 | S1 | Price | |
|---|---|---|---|---|
| ProTrendLines | 93.66 | 97.82 | 105.80 | 105.91 |
| Change (%) | -11.57% | -7.64% | -0.10% | - |
| Change | -12.25 | -8.09 | -0.11 | - |
| Level | Major | Major | Major | - |
Pivot points can also be used to set your price objectives. Here is the price situation in relation to pivot points:
| Pivot points | S3 | S2 | S1 | PP | R1 | R2 | R3 |
|---|---|---|---|---|---|---|---|
| Standard | 101.21 | 102.47 | 104.23 | 105.49 | 107.25 | 108.51 | 110.27 |
| Camarilla | 105.15 | 105.43 | 105.70 | 105.98 | 106.26 | 106.53 | 106.81 |
| Woodie | 101.45 | 102.60 | 104.47 | 105.62 | 107.49 | 108.64 | 110.51 |
| Fibonacci | 102.47 | 103.63 | 104.34 | 105.49 | 106.65 | 107.36 | 108.51 |
| Pivot points | S3 | S2 | S1 | PP | R1 | R2 | R3 |
|---|---|---|---|---|---|---|---|
| Standard | 87.22 | 91.11 | 97.49 | 101.38 | 107.76 | 111.65 | 118.03 |
| Camarilla | 101.04 | 101.98 | 102.92 | 103.86 | 104.80 | 105.74 | 106.68 |
| Woodie | 88.46 | 91.73 | 98.73 | 102.00 | 109.00 | 112.27 | 119.27 |
| Fibonacci | 91.11 | 95.04 | 97.46 | 101.38 | 105.31 | 107.73 | 111.65 |
| Pivot points | S3 | S2 | S1 | PP | R1 | R2 | R3 |
|---|---|---|---|---|---|---|---|
| Standard | 70.46 | 77.40 | 85.32 | 92.26 | 100.18 | 107.12 | 115.04 |
| Camarilla | 89.15 | 90.52 | 91.88 | 93.24 | 94.60 | 95.96 | 97.33 |
| Woodie | 70.95 | 77.65 | 85.81 | 92.51 | 100.67 | 107.37 | 115.53 |
| Fibonacci | 77.40 | 83.08 | 86.58 | 92.26 | 97.94 | 101.44 | 107.12 |
Numerical data
The following is the status of technical indicators and moving averages registered at the time this technical analysis was created:
| RSI (14): | 57.63 | |
| MACD (12,26,9): | 1.0500 | |
| Directional Movement: | 12.14 | |
| AROON (14): | 64.29 | |
| DEMA (21): | 106.88 | |
| Parabolic SAR (0,02-0,02-0,2): | 107.91 | |
| Elder Ray (13): | -0.01 | |
| Super Trend (3,10): | 104.39 | |
| Zig ZAG (10): | 105.56 | |
| VORTEX (21): | 1.0500 | |
| Stochastique (14,3,5): | 60.28 | |
| TEMA (21): | 106.67 | |
| Williams %R (14): | -52.16 | |
| Chande Momentum Oscillator (20): | 1.17 | |
| Repulse (5,40,3): | -1.2300 | |
| ROCnROLL: | -1 | |
| TRIX (15,9): | 0.1500 | |
| Courbe Coppock: | 4.98 |
| MA7: | 103.48 | |
| MA20: | 97.52 | |
| MA50: | 92.33 | |
| MA100: | 90.71 | |
| MAexp7: | 106.16 | |
| MAexp20: | 105.44 | |
| MAexp50: | 103.04 | |
| MAexp100: | 100.13 | |
| Price / MA7: | +2.35% | |
| Price / MA20: | +8.60% | |
| Price / MA50: | +14.71% | |
| Price / MA100: | +16.76% | |
| Price / MAexp7: | -0.24% | |
| Price / MAexp20: | +0.45% | |
| Price / MAexp50: | +2.79% | |
| Price / MAexp100: | +5.77% |
News
The latest news and videos published on SEAGATE TECHNOLOGY HLD. at the time of the analysis were as follows:
- Seagate Federal and KLC Group Announce Strategic Partnership for NSA CSfC Data-at-Rest Solutions
- OORT Collaborates with Seagate Lyve Services to Strengthen AI-Focused Decentralized Cloud Services
- SHAREHOLDER ALERT: Levi & Korsinsky Notifies Seagate Technology Holdings plc(STX) Investors of a Class Action Lawsuit and Upcoming Deadline
- STX Investors Have Opportunity to Lead Seagate Technology Holdings plc Securities Fraud Lawsuit
- SHAREHOLDER ALERT: The Gross Law Firm Notifies Shareholders of Seagate Technology Holdings plc of a Class Action Lawsuit and a Lead Plaintiff Deadline of September 8, 2023 - (NASDAQ: STX)
About author
Online


Add a comment
Comments
0 comments on the analysis SEAGATE TECHNOLOGY HLD. - 1H