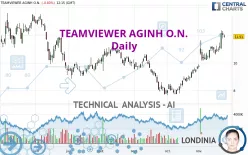
TEAMVIEWER SEINH O.N. - Daily - Technical analysis published on 11/24/2022 (GMT)
- 228
- 0
Click here for a new analysis!
- Timeframe : Daily
- - Analysis generated on
- Status : TARGET REACHED

Summary of the analysis

Additional analysis
Quotes
TEAMVIEWER AGINH O.N. rating 11.910 EUR. The price is lower by -0.83% since the last closing and was between 11.820 EUR and 12.070 EUR. This implies that the price is at +0.76% from its lowest and at -1.33% from its highest.The Central Gaps scanner detects a bearish opening. A small advantage for sellers in the very short term.
Bearish opening
Type : Bearish
Timeframe : Openning
Here is a more detailed summary of the historical variations registered by TEAMVIEWER AGINH O.N.:
Near a new HIGH record (1 month)
Type : Bullish
Timeframe : Weekly
Technical
Technical analysis of this Daily chart of TEAMVIEWER AGINH O.N. indicates that the overall trend is strongly bullish. 85.71% of the signals given by moving averages are bullish. This strongly bullish trend is supported by the strong bullish signals given by short-term moving averages. The Central Indicators scanner does not detect any result on moving averages that would impact this trend.
In fact, 14 technical indicators on 18 studied are currently bullish. Caution: the Central Indicators scanner currently detects an excess:
CCI indicator is overbought : over 100
Type : Neutral
Timeframe : Daily
CCI indicator: bearish divergence
Type : Bearish
Timeframe : Daily
Pivot points : price is over resistance 3
Type : Neutral
Timeframe : Weekly
An analysis of the price chart with the Central Patterns scanner (detector of chart patterns and resistances and supports) shows a result that can have an impact on the price change:
Resistance of channel is broken
Type : Bullish
Timeframe : Daily
The Central Candlesticks scanner which studies Japanese candlesticks did not detect anything.
| S3 | S2 | S1 | Price | R1 | R2 | R3 | |
|---|---|---|---|---|---|---|---|
| ProTrendLines | 9.133 | 10.190 | 10.815 | 11.910 | 12.507 | 13.449 | 14.500 |
| Change (%) | -23.32% | -14.44% | -9.19% | - | +5.01% | +12.92% | +21.75% |
| Change | -2.777 | -1.720 | -1.095 | - | +0.597 | +1.539 | +2.590 |
| Level | Minor | Minor | Major | - | Intermediate | Major | Minor |
Attention could also be paid to pivot points to set price objectives:
| Pivot points | S3 | S2 | S1 | PP | R1 | R2 | R3 |
|---|---|---|---|---|---|---|---|
| Standard | 11.200 | 11.480 | 11.745 | 12.025 | 12.290 | 12.570 | 12.835 |
| Camarilla | 11.860 | 11.910 | 11.960 | 12.010 | 12.060 | 12.110 | 12.160 |
| Woodie | 11.193 | 11.476 | 11.738 | 12.021 | 12.283 | 12.566 | 12.828 |
| Fibonacci | 11.480 | 11.688 | 11.817 | 12.025 | 12.233 | 12.362 | 12.570 |
| Pivot points | S3 | S2 | S1 | PP | R1 | R2 | R3 |
|---|---|---|---|---|---|---|---|
| Standard | 9.977 | 10.288 | 10.627 | 10.938 | 11.277 | 11.588 | 11.927 |
| Camarilla | 10.786 | 10.846 | 10.905 | 10.965 | 11.025 | 11.084 | 11.144 |
| Woodie | 9.990 | 10.295 | 10.640 | 10.945 | 11.290 | 11.595 | 11.940 |
| Fibonacci | 10.288 | 10.537 | 10.690 | 10.938 | 11.187 | 11.340 | 11.588 |
| Pivot points | S3 | S2 | S1 | PP | R1 | R2 | R3 |
|---|---|---|---|---|---|---|---|
| Standard | 6.280 | 6.974 | 8.354 | 9.048 | 10.428 | 11.122 | 12.502 |
| Camarilla | 9.164 | 9.354 | 9.544 | 9.734 | 9.924 | 10.114 | 10.304 |
| Woodie | 6.623 | 7.146 | 8.697 | 9.220 | 10.771 | 11.294 | 12.845 |
| Fibonacci | 6.974 | 7.766 | 8.256 | 9.048 | 9.840 | 10.330 | 11.122 |
Numerical data
The following is the status of technical indicators and moving averages registered at the time this technical analysis was created:
| RSI (14): | 69.77 | |
| MACD (12,26,9): | 0.6510 | |
| Directional Movement: | 28.867 | |
| AROON (14): | 85.714 | |
| DEMA (21): | 11.650 | |
| Parabolic SAR (0,02-0,02-0,2): | 10.669 | |
| Elder Ray (13): | 0.759 | |
| Super Trend (3,10): | 10.396 | |
| Zig ZAG (10): | 11.910 | |
| VORTEX (21): | 1.1380 | |
| Stochastique (14,3,5): | 84.72 | |
| TEMA (21): | 12.007 | |
| Williams %R (14): | -20.94 | |
| Chande Momentum Oscillator (20): | 1.305 | |
| Repulse (5,40,3): | 3.6110 | |
| ROCnROLL: | 1 | |
| TRIX (15,9): | 0.8860 | |
| Courbe Coppock: | 25.70 |
| MA7: | 11.412 | |
| MA20: | 10.801 | |
| MA50: | 9.452 | |
| MA100: | 9.783 | |
| MAexp7: | 11.553 | |
| MAexp20: | 10.828 | |
| MAexp50: | 10.126 | |
| MAexp100: | 10.155 | |
| Price / MA7: | +4.36% | |
| Price / MA20: | +10.27% | |
| Price / MA50: | +26.01% | |
| Price / MA100: | +21.74% | |
| Price / MAexp7: | +3.09% | |
| Price / MAexp20: | +9.99% | |
| Price / MAexp50: | +17.62% | |
| Price / MAexp100: | +17.28% |
News
The last news published on TEAMVIEWER AGINH O.N. at the time of the generation of this analysis was as follows:
- EQS-News: TeamViewer AG: Q3/9M 2022: TeamViewer with strong profitability and good topline growth; on track to meet full-year guidance
- EQS-News: TeamViewer ranks among Top 3 in Sustainalytics ESG risk rating
- DGAP-News: Ralf W. Dieter, former CEO of Dürr AG, to become new member of TeamViewer’s Supervisory Board
- DGAP-News: Q2/H1 2022: TeamViewer with continued strong profitability and 12% topline growth amid macroeconomic uncertainties
- DGAP-News: TeamViewer AG: Q1 2022: TeamViewer continues growth trajectory fueled by growing Enterprise business; increases profitability
About author
Online


Add a comment
Comments
0 comments on the analysis TEAMVIEWER SEINH O.N. - Daily