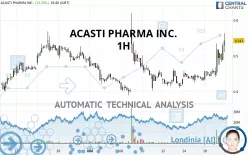
ACASTI PHARMA INC. - 1H - Technical analysis published on 05/19/2021 (GMT)
- 316
- 0
Click here for a new analysis!
- Timeframe : 1H
- - Analysis generated on
- Status : TARGET REACHED

Summary of the analysis
Additional analysis
Quotes
The ACASTI PHARMA INC. price is 0.543 USD. On the day, this instrument gained +19.34% and was traded between 0.440 USD and 0.564 USD over the period. The price is currently at +23.41% from its lowest and -3.72% from its highest.The Central Gaps scanner detects a bearish opening. A small advantage for sellers in the very short term.
Bearish opening
Type : Bearish
Timeframe : Openning
So that you have an overall view of the price change, here is a table showing the variations over several periods:
Technical
Technical analysis of this 1H chart of ACASTI PHARMA INC. indicates that the overall trend is slightly bullish. 53.57% of the signals given by moving averages are bullish. The slightly bullish signals given by short-term moving averages do not show a strengthening of this global trend. The Central Indicators market scanner is currently detecting a bullish signal that could impact this trend:
Moving Average bullish crossovers : AMA20 & AMA50
Type : Bullish
Timeframe : 1 hour
An assessment of technical indicators shows a strong bullish signal.
Caution: the Central Indicators scanner currently detects an excess:
CCI indicator is overbought : over 100
Type : Neutral
Timeframe : 1 hour
Pivot points : price is over resistance 2
Type : Neutral
Timeframe : 1 hour
Price is back under the pivot point
Type : Bearish
Timeframe : Weekly
The analysis of the price chart with Central Patterns scanners does not return any result.
For a small rebound in the very short term, the Central Candlesticks scanner currently notes the presence of this bullish pattern in Japanese candlesticks:
Long white line
Type : Bullish
Timeframe : 1 hour
| S3 | S2 | S1 | Price | R1 | R2 | R3 | |
|---|---|---|---|---|---|---|---|
| ProTrendLines | 0.431 | 0.455 | 0.528 | 0.543 | 0.569 | 0.620 | 0.652 |
| Change (%) | -20.63% | -16.21% | -2.76% | - | +4.79% | +14.18% | +20.07% |
| Change | -0.112 | -0.088 | -0.015 | - | +0.026 | +0.077 | +0.109 |
| Level | Minor | Major | Minor | - | Intermediate | Intermediate | Minor |
Pivot points can also be used to set your price objectives. Here is the price situation in relation to pivot points:
| Pivot points | S3 | S2 | S1 | PP | R1 | R2 | R3 |
|---|---|---|---|---|---|---|---|
| Standard | 0.403 | 0.418 | 0.436 | 0.451 | 0.469 | 0.484 | 0.502 |
| Camarilla | 0.446 | 0.449 | 0.452 | 0.455 | 0.458 | 0.461 | 0.464 |
| Woodie | 0.406 | 0.419 | 0.439 | 0.452 | 0.472 | 0.485 | 0.505 |
| Fibonacci | 0.418 | 0.430 | 0.438 | 0.451 | 0.463 | 0.471 | 0.484 |
| Pivot points | S3 | S2 | S1 | PP | R1 | R2 | R3 |
|---|---|---|---|---|---|---|---|
| Standard | 0.294 | 0.349 | 0.392 | 0.447 | 0.490 | 0.545 | 0.588 |
| Camarilla | 0.409 | 0.418 | 0.427 | 0.436 | 0.445 | 0.454 | 0.463 |
| Woodie | 0.289 | 0.346 | 0.387 | 0.444 | 0.485 | 0.542 | 0.583 |
| Fibonacci | 0.349 | 0.386 | 0.409 | 0.447 | 0.484 | 0.507 | 0.545 |
| Pivot points | S3 | S2 | S1 | PP | R1 | R2 | R3 |
|---|---|---|---|---|---|---|---|
| Standard | 0.110 | 0.246 | 0.369 | 0.505 | 0.628 | 0.764 | 0.887 |
| Camarilla | 0.422 | 0.446 | 0.469 | 0.493 | 0.517 | 0.541 | 0.564 |
| Woodie | 0.105 | 0.243 | 0.364 | 0.502 | 0.623 | 0.761 | 0.882 |
| Fibonacci | 0.246 | 0.345 | 0.406 | 0.505 | 0.604 | 0.665 | 0.764 |
Numerical data
The following is the status of the technical indicators and moving averages at the time of publication of this technical analysis:
| RSI (14): | 55.36 | |
| MACD (12,26,9): | 0.0040 | |
| Directional Movement: | 10.559 | |
| AROON (14): | 85.714 | |
| DEMA (21): | 0.450 | |
| Parabolic SAR (0,02-0,02-0,2): | 0.411 | |
| Elder Ray (13): | 0.008 | |
| Super Trend (3,10): | 0.468 | |
| Zig ZAG (10): | 0.454 | |
| VORTEX (21): | 1.0980 | |
| Stochastique (14,3,5): | 81.87 | |
| TEMA (21): | 0.455 | |
| Williams %R (14): | -27.96 | |
| Chande Momentum Oscillator (20): | 0.014 | |
| Repulse (5,40,3): | 0.5560 | |
| ROCnROLL: | 1 | |
| TRIX (15,9): | 0.0710 | |
| Courbe Coppock: | 4.95 |
| MA7: | 0.441 | |
| MA20: | 0.461 | |
| MA50: | 0.542 | |
| MA100: | 0.619 | |
| MAexp7: | 0.452 | |
| MAexp20: | 0.446 | |
| MAexp50: | 0.446 | |
| MAexp100: | 0.454 | |
| Price / MA7: | +23.13% | |
| Price / MA20: | +17.79% | |
| Price / MA50: | +0.18% | |
| Price / MA100: | -12.28% | |
| Price / MAexp7: | +20.13% | |
| Price / MAexp20: | +21.75% | |
| Price / MAexp50: | +21.75% | |
| Price / MAexp100: | +19.60% |
News
The latest news and videos published on ACASTI PHARMA INC. at the time of the analysis were as follows:
- Acasti Intends to Request Hearing Before Nasdaq Panel to Present Plan of Compliance
- ACASTI PHARMA INVESTOR ALERT by the Former Attorney General of Louisiana: Kahn Swick & Foti, LLC Investigates Merger of Acasti Pharma Inc. - ACST
-
 Acasti Pharma Inc. - ACST Stock Chart Technical Analysis for 05-07-2021
-
“The Buzz” Show: Acasti Pharma Inc. (NASDAQ: ACST) to Acquire Grace Therapeutics, Inc.
- Acasti Pharma Merger Investigation: Halper Sadeh LLP Announces Investigation Into Whether the Merger of Acasti Pharma Inc. Is Fair to Shareholders; Investors Are Encouraged to Contact the Firm – ACST
About author

Online


Add a comment
Comments
0 comments on the analysis ACASTI PHARMA INC. - 1H