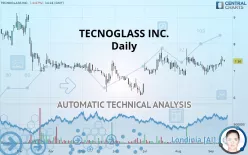
TECNOGLASS INC. - Daily - Technical analysis published on 09/16/2019 (GMT)
- 289
- 0
- Who voted?
Click here for a new analysis!
- Timeframe : Daily
- - Analysis generated on
- Status : TARGET REACHED

Summary of the analysis

Additional analysis
Quotes
The TECNOGLASS INC. price is 7.36 USD. The price registered a decrease of -0.68% on the session and was between 7.32 USD and 7.40 USD. This implies that the price is at +0.55% from its lowest and at -0.54% from its highest.The Central Gaps scanner detects a bearish opening marking the presence of sellers ahead of buyers at the opening but not sufficiently marked to allow the price to register a quotation gap.
Bearish opening
Type : Bearish
Timeframe : Openning
A study of price movements over other periods shows the following variations:
Near a new HIGH record (1 month)
Type : Bullish
Timeframe : Weekly
Technical
A technical analysis in Daily of this TECNOGLASS INC. chart shows a strongly bullish trend. 92.86% of the signals given by moving averages are bullish. This strongly bullish trend is supported by the strong bullish signals given by short-term moving averages. The Central Indicators scanner detects a bullish signal on moving averages that could impact this trend:
Bullish trend reversal : Moving Average 20
Type : Bullish
Timeframe : Daily
Technical indicators are strongly bullish, suggesting that the price increase should continue.
Caution: the Central Indicators scanner currently detects an excess:
CCI indicator is overbought : over 100
Type : Neutral
Timeframe : Daily
Williams %R indicator is overbought : over -20
Type : Neutral
Timeframe : Daily
Price is back over the pivot point
Type : Bullish
Timeframe : Weekly
Central Patterns, the scanner specializing in chart patterns, did not identify any signals.
The Central Candlesticks scanner which studies Japanese candlesticks did not detect anything.
| S3 | S2 | S1 | Price | R1 | R2 | R3 | |
|---|---|---|---|---|---|---|---|
| ProTrendLines | 6.08 | 6.48 | 6.99 | 7.36 | 7.61 | 8.25 | 8.99 |
| Change (%) | -17.39% | -11.96% | -5.03% | - | +3.40% | +12.09% | +22.15% |
| Change | -1.28 | -0.88 | -0.37 | - | +0.25 | +0.89 | +1.63 |
| Level | Major | Minor | Major | - | Major | Minor | Major |
Attention could also be paid to pivot points to set price objectives:
| Pivot points | S3 | S2 | S1 | PP | R1 | R2 | R3 |
|---|---|---|---|---|---|---|---|
| Standard | 7.19 | 7.27 | 7.34 | 7.42 | 7.49 | 7.57 | 7.64 |
| Camarilla | 7.37 | 7.38 | 7.40 | 7.41 | 7.42 | 7.44 | 7.45 |
| Woodie | 7.19 | 7.27 | 7.34 | 7.42 | 7.49 | 7.57 | 7.64 |
| Fibonacci | 7.27 | 7.33 | 7.36 | 7.42 | 7.48 | 7.51 | 7.57 |
| Pivot points | S3 | S2 | S1 | PP | R1 | R2 | R3 |
|---|---|---|---|---|---|---|---|
| Standard | 6.66 | 6.87 | 7.14 | 7.34 | 7.61 | 7.82 | 8.09 |
| Camarilla | 7.28 | 7.32 | 7.37 | 7.41 | 7.45 | 7.50 | 7.54 |
| Woodie | 6.70 | 6.88 | 7.17 | 7.36 | 7.65 | 7.83 | 8.12 |
| Fibonacci | 6.87 | 7.05 | 7.16 | 7.34 | 7.52 | 7.64 | 7.82 |
| Pivot points | S3 | S2 | S1 | PP | R1 | R2 | R3 |
|---|---|---|---|---|---|---|---|
| Standard | 5.70 | 6.26 | 6.71 | 7.27 | 7.72 | 8.28 | 8.73 |
| Camarilla | 6.89 | 6.99 | 7.08 | 7.17 | 7.26 | 7.36 | 7.45 |
| Woodie | 5.66 | 6.23 | 6.67 | 7.24 | 7.68 | 8.25 | 8.69 |
| Fibonacci | 6.26 | 6.64 | 6.88 | 7.27 | 7.65 | 7.89 | 8.28 |
Numerical data
The following are the details of the technical indicators and moving averages that were collected to generate this technical analysis:
| RSI (14): | 60.56 | |
| MACD (12,26,9): | 0.0600 | |
| Directional Movement: | 7.30 | |
| AROON (14): | 71.42 | |
| DEMA (21): | 7.31 | |
| Parabolic SAR (0,02-0,02-0,2): | 6.87 | |
| Elder Ray (13): | 0.09 | |
| Super Trend (3,10): | 6.82 | |
| Zig ZAG (10): | 7.39 | |
| VORTEX (21): | 1.0100 | |
| Stochastique (14,3,5): | 79.76 | |
| TEMA (21): | 7.32 | |
| Williams %R (14): | -22.14 | |
| Chande Momentum Oscillator (20): | 0.40 | |
| Repulse (5,40,3): | 2.5200 | |
| ROCnROLL: | 1 | |
| TRIX (15,9): | 0.0600 | |
| Courbe Coppock: | 4.62 |
| MA7: | 7.31 | |
| MA20: | 7.20 | |
| MA50: | 7.18 | |
| MA100: | 6.93 | |
| MAexp7: | 7.32 | |
| MAexp20: | 7.24 | |
| MAexp50: | 7.14 | |
| MAexp100: | 7.12 | |
| Price / MA7: | +0.68% | |
| Price / MA20: | +2.22% | |
| Price / MA50: | +2.51% | |
| Price / MA100: | +6.20% | |
| Price / MAexp7: | +0.55% | |
| Price / MAexp20: | +1.66% | |
| Price / MAexp50: | +3.08% | |
| Price / MAexp100: | +3.37% |
News
Don"t forget to follow the news on TECNOGLASS INC.. At the time of publication of this analysis, the latest news was as follows:
- Tecnoglass Appoints Carlos Alfredo Cure Cure as a New Director
- Tecnoglass to Present at the D.A. Davidson 18th Annual Diversified Industrials & Services Conference
- Tecnoglass Reports Second Quarter 2019 Results
- Tecnoglass Sets Date for Second Quarter 2019 Earnings Release and Conference Call
- Tecnoglass Reports First Quarter 2019 Results
About author

Online


Add a comment
Comments
0 comments on the analysis TECNOGLASS INC. - Daily