CITIGROUP INC. - 1H - Technical analysis published on 10/24/2024 (GMT)
- 146
- 0
Click here for a new analysis!
- Timeframe : 1H
- - Analysis generated on
- Status : TARGET REACHED

Summary of the analysis

Additional analysis
Quotes
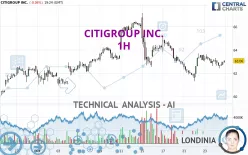
The CITIGROUP INC. rating is 63.06 USD. The price is lower by -0.06% since the last closing with the lowest point at 62.39 USD and the highest point at 63.30 USD. The deviation from the price is +1.07% for the low point and -0.38% for the high point.The Central Gaps scanner detects a bearish opening. A small advantage for sellers in the very short term.
Bearish opening
Type : Bearish
Timeframe : Openning
A study of price movements over other periods shows the following variations:
Near a new LOW record (1 month)
Type : Bearish
Timeframe : Weekly
Technical
A technical analysis in 1H of this CITIGROUP INC. chart shows a bearish trend. The signals given by moving averages are 67.86% bearish. This bearish trend could slow down given the neutral signals currently being given by short-term moving averages. The Central Indicators market scanner currently does not detect any result that concerns moving averages.
In fact, Central Analyzer took into account 18 technical indicators and the result was as follows: 6 are bullish, 7 are neutral and 5 are bearish. Central Indicators, the detector scanner for these technical indicators has recently detected several signals:
RSI indicator is back over 50
Type : Bullish
Timeframe : 1 hour
MACD crosses UP its Moving Average
Type : Bullish
Timeframe : 1 hour
Williams %R indicator is back over -50
Type : Bullish
Timeframe : 1 hour
Central Patterns, the market scanner focusing on chart patterns, resistances and supports found these results:
Near horizontal resistance
Type : Bearish
Timeframe : 1 hour
Near resistance of channel
Type : Bearish
Timeframe : 1 hour
The Central Candlesticks scanner, specialised in Japanese candlesticks, did not identify any signals.
| S3 | S2 | S1 | Price | R1 | R2 | R3 | |
|---|---|---|---|---|---|---|---|
| ProTrendLines | 60.11 | 60.96 | 61.76 | 63.06 | 63.15 | 65.17 | 66.90 |
| Change (%) | -4.68% | -3.33% | -2.06% | - | +0.14% | +3.35% | +6.09% |
| Change | -2.95 | -2.10 | -1.30 | - | +0.09 | +2.11 | +3.84 |
| Level | Intermediate | Major | Intermediate | - | Major | Minor | Major |
Pivot points can also be used to set your price objectives. Here is the price situation in relation to pivot points:
| Pivot points | S3 | S2 | S1 | PP | R1 | R2 | R3 |
|---|---|---|---|---|---|---|---|
| Standard | 61.59 | 62.11 | 62.60 | 63.12 | 63.61 | 64.13 | 64.62 |
| Camarilla | 62.82 | 62.92 | 63.01 | 63.10 | 63.19 | 63.29 | 63.38 |
| Woodie | 61.59 | 62.10 | 62.60 | 63.11 | 63.61 | 64.12 | 64.62 |
| Fibonacci | 62.11 | 62.49 | 62.73 | 63.12 | 63.50 | 63.74 | 64.13 |
| Pivot points | S3 | S2 | S1 | PP | R1 | R2 | R3 |
|---|---|---|---|---|---|---|---|
| Standard | 56.57 | 59.55 | 61.20 | 64.18 | 65.83 | 68.81 | 70.46 |
| Camarilla | 61.58 | 62.00 | 62.43 | 62.85 | 63.27 | 63.70 | 64.12 |
| Woodie | 55.91 | 59.22 | 60.54 | 63.85 | 65.17 | 68.48 | 69.80 |
| Fibonacci | 59.55 | 61.32 | 62.41 | 64.18 | 65.95 | 67.04 | 68.81 |
| Pivot points | S3 | S2 | S1 | PP | R1 | R2 | R3 |
|---|---|---|---|---|---|---|---|
| Standard | 51.14 | 53.66 | 58.13 | 60.65 | 65.12 | 67.64 | 72.11 |
| Camarilla | 60.68 | 61.32 | 61.96 | 62.60 | 63.24 | 63.88 | 64.52 |
| Woodie | 52.12 | 54.15 | 59.11 | 61.14 | 66.10 | 68.13 | 73.09 |
| Fibonacci | 53.66 | 56.33 | 57.98 | 60.65 | 63.32 | 64.97 | 67.64 |
Numerical data
The following is the status of technical indicators and moving averages registered at the time this technical analysis was created:
| RSI (14): | 48.78 | |
| MACD (12,26,9): | -0.0900 | |
| Directional Movement: | -7.53 | |
| AROON (14): | -64.28 | |
| DEMA (21): | 62.82 | |
| Parabolic SAR (0,02-0,02-0,2): | 63.61 | |
| Elder Ray (13): | 0.03 | |
| Super Trend (3,10): | 62.04 | |
| Zig ZAG (10): | 62.97 | |
| VORTEX (21): | 1.1300 | |
| Stochastique (14,3,5): | 40.05 | |
| TEMA (21): | 62.92 | |
| Williams %R (14): | -52.02 | |
| Chande Momentum Oscillator (20): | -0.41 | |
| Repulse (5,40,3): | 0.3600 | |
| ROCnROLL: | -1 | |
| TRIX (15,9): | -0.0200 | |
| Courbe Coppock: | 0.91 |
| MA7: | 63.23 | |
| MA20: | 63.13 | |
| MA50: | 61.62 | |
| MA100: | 61.68 | |
| MAexp7: | 62.91 | |
| MAexp20: | 62.96 | |
| MAexp50: | 63.20 | |
| MAexp100: | 63.13 | |
| Price / MA7: | -0.27% | |
| Price / MA20: | -0.11% | |
| Price / MA50: | +2.34% | |
| Price / MA100: | +2.24% | |
| Price / MAexp7: | +0.24% | |
| Price / MAexp20: | +0.16% | |
| Price / MAexp50: | -0.22% | |
| Price / MAexp100: | -0.11% |
News
The last news published on CITIGROUP INC. at the time of the generation of this analysis was as follows:
- Investor Network: Citigroup Inc to Host Earnings Call
- Communications Sales & Leasing to Present at the Citi 2017 Internet, Media & Telecommunications Conference
- Amgen To Present At The Citi 2016 Global Healthcare Conference
- VolitionRx Limited to Attend Citi 2016 Global Healthcare Conference
- Allergan to Present at 2016 Citi Global Healthcare Conference
About author
Online


Add a comment
Comments
0 comments on the analysis CITIGROUP INC. - 1H