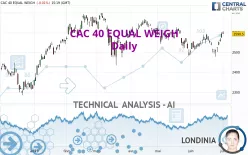
CAC 40 EQUAL WEIGH - Daily - Technical analysis published on 07/03/2023 (GMT)
- 173
- 0
Click here for a new analysis!
- Timeframe : Daily
- - Analysis generated on
- Status : LEVEL MAINTAINED

Summary of the analysis

Additional analysis
Quotes
The CAC 40 EQUAL WEIGH price is 2,590.50 EUR. On the day, this instrument lost -0.01% and was between 2,589.58 EUR and 2,604.56 EUR. This implies that the price is at +0.04% from its lowest and at -0.54% from its highest.So that you have an overall view of the price change, here is a table showing the variations over several periods:
Near a new HIGH record (5 years)
Type : Bullish
Timeframe : Weekly
Near a new HIGH record (1 year)
Type : Bullish
Timeframe : Weekly
Near a new HIGH record (1st january)
Type : Bullish
Timeframe : Weekly
New HIGH record (1 month)
Type : Bullish
Timeframe : Weekly
Technical
Technical analysis of this Daily chart of CAC 40 EQUAL WEIGH indicates that the overall trend is slightly bullish. 60.71% of the signals given by moving averages are bullish. The overall trend could accelerate as strong bullish signals from short-term moving averages are expected. The Central Indicators scanner does not detect any result on moving averages that would impact this trend.
In fact, 14 technical indicators on 18 studied are currently positioned bullish. Caution: the Central Indicators scanner currently detects an excess:
CCI indicator is overbought : over 100
Type : Neutral
Timeframe : Daily
Williams %R indicator is overbought : over -20
Type : Neutral
Timeframe : Daily
MACD indicator is back over 0
Type : Bullish
Timeframe : Daily
No signals are given by Central Patterns, a market scanner specialised in chart patterns, resistances and supports.
The Central Candlesticks scanner which studies Japanese candlesticks did not detect anything.
| S3 | S2 | S1 | Price | R1 | R2 | |
|---|---|---|---|---|---|---|
| ProTrendLines | 2,184.94 | 2,287.44 | 2,485.41 | 2,590.50 | 2,597.02 | 2,722.29 |
| Change (%) | -15.66% | -11.70% | -4.06% | - | +0.25% | +5.09% |
| Change | -405.56 | -303.06 | -105.09 | - | +6.52 | +131.79 |
| Level | Minor | Major | Major | - | Major | Major |
Attention could also be paid to pivot points to set price objectives:
| Pivot points | S3 | S2 | S1 | PP | R1 | R2 | R3 |
|---|---|---|---|---|---|---|---|
| Standard | 2,549.78 | 2,561.18 | 2,575.95 | 2,587.35 | 2,602.12 | 2,613.52 | 2,628.29 |
| Camarilla | 2,583.53 | 2,585.93 | 2,588.33 | 2,590.73 | 2,593.13 | 2,595.53 | 2,597.93 |
| Woodie | 2,551.48 | 2,562.02 | 2,577.65 | 2,588.19 | 2,603.82 | 2,614.36 | 2,629.99 |
| Fibonacci | 2,561.18 | 2,571.17 | 2,577.35 | 2,587.35 | 2,597.34 | 2,603.52 | 2,613.52 |
| Pivot points | S3 | S2 | S1 | PP | R1 | R2 | R3 |
|---|---|---|---|---|---|---|---|
| Standard | 2,388.22 | 2,431.92 | 2,511.33 | 2,555.03 | 2,634.44 | 2,678.14 | 2,757.55 |
| Camarilla | 2,556.88 | 2,568.16 | 2,579.45 | 2,590.73 | 2,602.02 | 2,613.30 | 2,624.59 |
| Woodie | 2,406.07 | 2,440.85 | 2,529.18 | 2,563.96 | 2,652.29 | 2,687.07 | 2,775.40 |
| Fibonacci | 2,431.92 | 2,478.95 | 2,508.01 | 2,555.03 | 2,602.06 | 2,631.12 | 2,678.14 |
Numerical data
The following is the status of the technical indicators and moving averages at the time of publication of this technical analysis:
| RSI (14): | 59.46 | |
| MACD (12,26,9): | 1.4600 | |
| Directional Movement: | 9.28 | |
| AROON (14): | 35.71 | |
| DEMA (21): | 2,549.62 | |
| Parabolic SAR (0,02-0,02-0,2): | 2,482.39 | |
| Elder Ray (13): | 43.75 | |
| Super Trend (3,10): | 2,515.79 | |
| Zig ZAG (10): | 2,590.29 | |
| VORTEX (21): | 1.0600 | |
| Stochastique (14,3,5): | 86.08 | |
| TEMA (21): | 2,559.46 | |
| Williams %R (14): | -9.66 | |
| Chande Momentum Oscillator (20): | 31.20 | |
| Repulse (5,40,3): | 0.6000 | |
| ROCnROLL: | 1 | |
| TRIX (15,9): | -0.0300 | |
| Courbe Coppock: | 0.41 |
| MA7: | 2,546.51 | |
| MA20: | 2,547.36 | |
| MA50: | 2,563.71 | |
| MA100: | 2,586.67 | |
| MAexp7: | 2,561.96 | |
| MAexp20: | 2,551.40 | |
| MAexp50: | 2,559.00 | |
| MAexp100: | 2,548.65 | |
| Price / MA7: | +1.73% | |
| Price / MA20: | +1.69% | |
| Price / MA50: | +1.04% | |
| Price / MA100: | +0.15% | |
| Price / MAexp7: | +1.11% | |
| Price / MAexp20: | +1.53% | |
| Price / MAexp50: | +1.23% | |
| Price / MAexp100: | +1.64% |
About author
Online


Add a comment
Comments
0 comments on the analysis CAC 40 EQUAL WEIGH - Daily