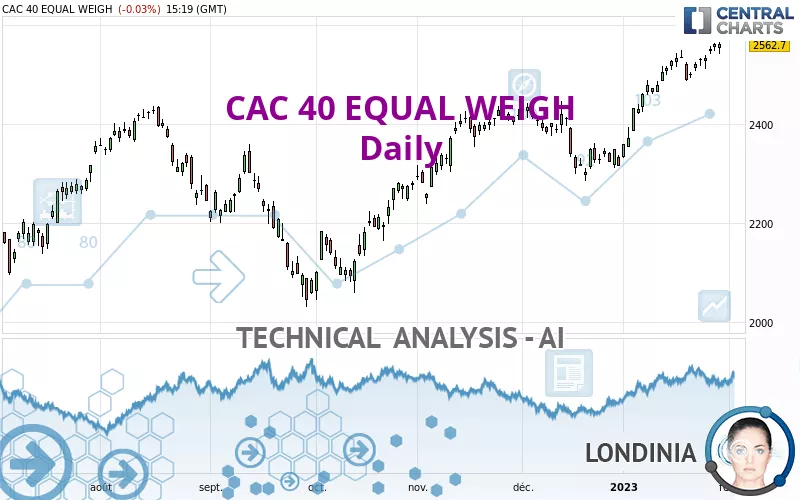
CAC 40 EQUAL WEIGH - Daily - Technical analysis published on 01/30/2023 (GMT)
- 171
- 0
Click here for a new analysis!
- Timeframe : Daily
- - Analysis generated on
- Status : TARGET REACHED
Summary of the analysis

Additional analysis
Quotes
The CAC 40 EQUAL WEIGH price is 2,562.70 EUR. The price registered a decrease of -0.03% on the session and was between 2,542.33 EUR and 2,566.53 EUR. This implies that the price is at +0.80% from its lowest and at -0.15% from its highest.The Central Gaps scanner detects a bearish opening. A small advantage for sellers in the very short term.
Bearish opening
Type : Bearish
Timeframe : Openning
Here is a more detailed summary of the historical variations registered by CAC 40 EQUAL WEIGH:
Near a new HIGH record (1 year)
Type : Bullish
Timeframe : Weekly
Near a new HIGH record (1st january)
Type : Bullish
Timeframe : Weekly
Near a new HIGH record (1 month)
Type : Bullish
Timeframe : Weekly
Technical
A technical analysis in Daily of this CAC 40 EQUAL WEIGH chart shows a strongly bullish trend. The signals given by the moving averages are 92.86% bullish. This strong bullish trend is confirmed by the strong signals currently being given by short-term moving averages. The Central Indicators scanner does not detect any result on moving averages that would impact this trend.
In fact, 14 technical indicators on 18 studied are currently positioned bullish. But beware of excesses. The Central Indicators scanner currently detects this:
CCI indicator is overbought : over 100
Type : Neutral
Timeframe : Daily
RSI indicator: bearish divergence
Type : Bearish
Timeframe : Daily
Williams %R indicator is overbought : over -20
Type : Neutral
Timeframe : Daily
Price is back over the pivot point
Type : Bullish
Timeframe : Daily
Central Patterns, the scanner specializing in chart patterns, did not identify any signals.
The Central Candlesticks scanner which studies Japanese candlesticks did not detect anything.
| S3 | S2 | S1 | Price | R1 | R2 | |
|---|---|---|---|---|---|---|
| ProTrendLines | 2,304.29 | 2,433.44 | 2,535.84 | 2,562.70 | 2,597.02 | 2,722.29 |
| Change (%) | -10.08% | -5.04% | -1.05% | - | +1.34% | +6.23% |
| Change | -258.41 | -129.26 | -26.86 | - | +34.32 | +159.59 |
| Level | Intermediate | Major | Major | - | Minor | Major |
Pivot points can also be used to set your price objectives. Here is the price situation in relation to pivot points:
| Pivot points | S3 | S2 | S1 | PP | R1 | R2 | R3 |
|---|---|---|---|---|---|---|---|
| Standard | 2,534.88 | 2,541.28 | 2,552.33 | 2,558.73 | 2,569.78 | 2,576.18 | 2,587.23 |
| Camarilla | 2,558.57 | 2,560.17 | 2,561.77 | 2,563.37 | 2,564.97 | 2,566.57 | 2,568.17 |
| Woodie | 2,537.20 | 2,542.44 | 2,554.65 | 2,559.89 | 2,572.10 | 2,577.34 | 2,589.55 |
| Fibonacci | 2,541.28 | 2,547.95 | 2,552.07 | 2,558.73 | 2,565.40 | 2,569.52 | 2,576.18 |
| Pivot points | S3 | S2 | S1 | PP | R1 | R2 | R3 |
|---|---|---|---|---|---|---|---|
| Standard | 2,469.94 | 2,489.34 | 2,526.35 | 2,545.75 | 2,582.76 | 2,602.16 | 2,639.17 |
| Camarilla | 2,547.86 | 2,553.03 | 2,558.20 | 2,563.37 | 2,568.54 | 2,573.71 | 2,578.88 |
| Woodie | 2,478.76 | 2,493.74 | 2,535.17 | 2,550.15 | 2,591.58 | 2,606.56 | 2,647.99 |
| Fibonacci | 2,489.34 | 2,510.89 | 2,524.20 | 2,545.75 | 2,567.30 | 2,580.61 | 2,602.16 |
| Pivot points | S3 | S2 | S1 | PP | R1 | R2 | R3 |
|---|---|---|---|---|---|---|---|
| Standard | 2,088.23 | 2,186.27 | 2,251.38 | 2,349.42 | 2,414.53 | 2,512.57 | 2,577.68 |
| Camarilla | 2,271.63 | 2,286.59 | 2,301.55 | 2,316.50 | 2,331.46 | 2,346.41 | 2,361.37 |
| Woodie | 2,071.78 | 2,178.04 | 2,234.93 | 2,341.19 | 2,398.08 | 2,504.34 | 2,561.23 |
| Fibonacci | 2,186.27 | 2,248.59 | 2,287.09 | 2,349.42 | 2,411.74 | 2,450.24 | 2,512.57 |
Numerical data
The following is the status of the technical indicators and moving averages at the time of publication of this technical analysis:
| RSI (14): | 69.45 | |
| MACD (12,26,9): | 43.0600 | |
| Directional Movement: | 19.52 | |
| AROON (14): | 92.86 | |
| DEMA (21): | 2,553.39 | |
| Parabolic SAR (0,02-0,02-0,2): | 2,522.92 | |
| Elder Ray (13): | 31.64 | |
| Super Trend (3,10): | 2,476.66 | |
| Zig ZAG (10): | 2,562.45 | |
| VORTEX (21): | 1.2800 | |
| Stochastique (14,3,5): | 96.53 | |
| TEMA (21): | 2,569.50 | |
| Williams %R (14): | -3.35 | |
| Chande Momentum Oscillator (20): | 55.85 | |
| Repulse (5,40,3): | 1.2900 | |
| ROCnROLL: | 1 | |
| TRIX (15,9): | 0.2400 | |
| Courbe Coppock: | 7.27 |
| MA7: | 2,537.71 | |
| MA20: | 2,499.38 | |
| MA50: | 2,427.21 | |
| MA100: | 2,328.55 | |
| MAexp7: | 2,542.64 | |
| MAexp20: | 2,498.04 | |
| MAexp50: | 2,432.95 | |
| MAexp100: | 2,382.18 | |
| Price / MA7: | +0.98% | |
| Price / MA20: | +2.53% | |
| Price / MA50: | +5.58% | |
| Price / MA100: | +10.06% | |
| Price / MAexp7: | +0.79% | |
| Price / MAexp20: | +2.59% | |
| Price / MAexp50: | +5.33% | |
| Price / MAexp100: | +7.58% |
About author
Online


Add a comment
Comments
0 comments on the analysis CAC 40 EQUAL WEIGH - Daily