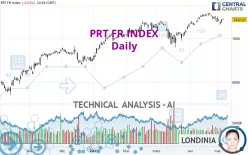
PRT FR INDEX - Daily - Technical analysis published on 05/08/2023 (GMT)
- 147
- 0
Click here for a new analysis!
- Timeframe : Daily
- - Analysis generated on
- Status : INVALID

Summary of the analysis

Additional analysis
Quotes
The PRT FR INDEX rating is 7,432.46 EUR. On the day, this instrument lost -0.01% and was between 7,415.92 EUR and 7,457.30 EUR. This implies that the price is at +0.22% from its lowest and at -0.33% from its highest.The Central Gaps scanner detects a bearish opening. A small advantage for sellers in the very short term.
Bearish opening
Type : Bearish
Timeframe : Openning
So that you have an overall view of the price change, here is a table showing the variations over several periods:
Near a new HIGH record (5 years)
Type : Bullish
Timeframe : Weekly
Near a new HIGH record (1 year)
Type : Bullish
Timeframe : Weekly
Near a new HIGH record (1st january)
Type : Bullish
Timeframe : Weekly
Near a new HIGH record (1 month)
Type : Bullish
Timeframe : Weekly
Technical
Technical analysis of PRT FR INDEX in Daily shows a strongly overall bullish trend. The signals given by moving averages are 85.71% bullish. This strongly bullish trend seems to be running out of steam given the signals being given by short-term moving averages. The Central Indicators market scanner is currently detecting several bearish and bullish signals that could impact this trend:
Bullish trend reversal : adaptative moving average 20
Type : Bullish
Timeframe : Daily
Moving Average bearish crossovers : AMA50 & AMA100
Type : Bearish
Timeframe : Daily
The technical indicators are generally neutral. They do not provide relevant information on the direction of future price movements.
The Central Indicators scanner found no further results concerning independent technical indicators.
Central Patterns, the scanner specializing in chart patterns, did not identify any signals.
The Central Candlesticks scanner which studies Japanese candlesticks did not detect anything.
| S3 | S2 | S1 | Price | R1 | |
|---|---|---|---|---|---|
| ProTrendLines | 6,450.43 | 6,885.71 | 7,376.37 | 7,432.46 | 7,577.00 |
| Change (%) | -13.21% | -7.36% | -0.75% | - | +1.94% |
| Change | -982.03 | -546.75 | -56.09 | - | +144.54 |
| Level | Minor | Intermediate | Major | - | Major |
To determine price objectives, it is also possible to use the pivot points. Here is the price position in relation to pivot points:
| Pivot points | S3 | S2 | S1 | PP | R1 | R2 | R3 |
|---|---|---|---|---|---|---|---|
| Standard | 7,294.72 | 7,324.51 | 7,378.72 | 7,408.51 | 7,462.72 | 7,492.51 | 7,546.72 |
| Camarilla | 7,409.83 | 7,417.53 | 7,425.23 | 7,432.93 | 7,440.63 | 7,448.33 | 7,456.03 |
| Woodie | 7,306.93 | 7,330.62 | 7,390.93 | 7,414.62 | 7,474.93 | 7,498.62 | 7,558.93 |
| Fibonacci | 7,324.51 | 7,356.60 | 7,376.42 | 7,408.51 | 7,440.60 | 7,460.42 | 7,492.51 |
| Pivot points | S3 | S2 | S1 | PP | R1 | R2 | R3 |
|---|---|---|---|---|---|---|---|
| Standard | 7,134.93 | 7,224.48 | 7,328.71 | 7,418.26 | 7,522.49 | 7,612.04 | 7,716.27 |
| Camarilla | 7,379.64 | 7,397.40 | 7,415.17 | 7,432.93 | 7,450.69 | 7,468.46 | 7,486.22 |
| Woodie | 7,142.26 | 7,228.15 | 7,336.04 | 7,421.93 | 7,529.82 | 7,615.71 | 7,723.60 |
| Fibonacci | 7,224.48 | 7,298.51 | 7,344.24 | 7,418.26 | 7,492.29 | 7,538.02 | 7,612.04 |
| Pivot points | S3 | S2 | S1 | PP | R1 | R2 | R3 |
|---|---|---|---|---|---|---|---|
| Standard | 7,052.63 | 7,176.43 | 7,333.97 | 7,457.77 | 7,615.31 | 7,739.11 | 7,896.65 |
| Camarilla | 7,414.13 | 7,439.92 | 7,465.71 | 7,491.50 | 7,517.29 | 7,543.08 | 7,568.87 |
| Woodie | 7,069.49 | 7,184.87 | 7,350.83 | 7,466.21 | 7,632.17 | 7,747.55 | 7,913.51 |
| Fibonacci | 7,176.43 | 7,283.91 | 7,350.30 | 7,457.77 | 7,565.25 | 7,631.64 | 7,739.11 |
Numerical data
The following are the details of the technical indicators and moving averages that were collected to generate this technical analysis:
| RSI (14): | 53.18 | |
| MACD (12,26,9): | 35.6900 | |
| Directional Movement: | -4.39 | |
| AROON (14): | -50.00 | |
| DEMA (21): | 7,482.60 | |
| Parabolic SAR (0,02-0,02-0,2): | 7,510.24 | |
| Elder Ray (13): | -1.68 | |
| Super Trend (3,10): | 7,598.68 | |
| Zig ZAG (10): | 7,435.30 | |
| VORTEX (21): | 0.9200 | |
| Stochastique (14,3,5): | 32.95 | |
| TEMA (21): | 7,461.19 | |
| Williams %R (14): | -55.76 | |
| Chande Momentum Oscillator (20): | -116.60 | |
| Repulse (5,40,3): | 0.0900 | |
| ROCnROLL: | -1 | |
| TRIX (15,9): | 0.1300 | |
| Courbe Coppock: | 0.91 |
| MA7: | 7,424.74 | |
| MA20: | 7,467.88 | |
| MA50: | 7,304.28 | |
| MA100: | 7,120.72 | |
| MAexp7: | 7,430.64 | |
| MAexp20: | 7,422.88 | |
| MAexp50: | 7,315.69 | |
| MAexp100: | 7,127.87 | |
| Price / MA7: | +0.10% | |
| Price / MA20: | -0.47% | |
| Price / MA50: | +1.75% | |
| Price / MA100: | +4.38% | |
| Price / MAexp7: | +0.02% | |
| Price / MAexp20: | +0.13% | |
| Price / MAexp50: | +1.60% | |
| Price / MAexp100: | +4.27% |
About author
Online


Add a comment
Comments
0 comments on the analysis PRT FR INDEX - Daily