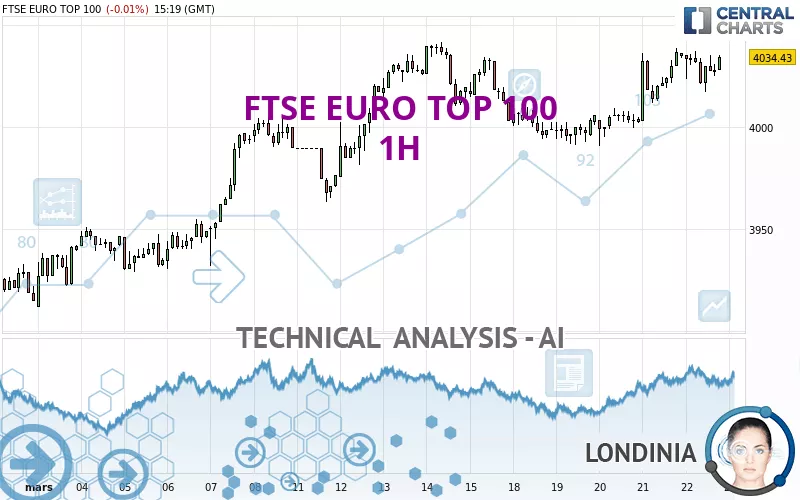
FTSE EURO TOP 100 - 1H - Technical analysis published on 03/22/2024 (GMT)
- 162
- 0
Click here for a new analysis!
- Timeframe : 1H
- - Analysis generated on
- Status : TARGET REACHED
Summary of the analysis

Additional analysis
Quotes
The FTSE EURO TOP 100 rating is 4,032.55 EUR. The price registered a decrease of -0.06% on the session and was traded between 4,017.31 EUR and 4,037.08 EUR over the period. The price is currently at +0.38% from its lowest and -0.11% from its highest.The Central Gaps scanner detects a bullish opening. A small advantage for buyers in the very short term.
Bullish opening
Type : Bullish
Timeframe : Openning
A study of price movements over other periods shows the following variations:
Near a new HIGH record (5 years)
Type : Bullish
Timeframe : Weekly
Near a new HIGH record (1 year)
Type : Bullish
Timeframe : Weekly
Near a new HIGH record (1st january)
Type : Bullish
Timeframe : Weekly
Near a new LOW record (1 month)
Type : Bearish
Timeframe : Weekly
Technical
Technical analysis of FTSE EURO TOP 100 in 1H shows a strongly overall bullish trend. 92.86% of the signals given by moving averages are bullish. This strongly bullish trend is supported by the strong bullish signals given by short-term moving averages. There is no crossing of moving average by the price or crossing of moving averages between themselves.
In fact, only 8 technical indicators out of 18 studied are currently bullish. The Central Indicators scanner found this result concerning these indicators:
Price is back over the pivot point
Type : Bullish
Timeframe : Weekly
The analysis of the price chart with Central Patterns scanners does not return any result.
No result was found by the Central Candlesticks scanner on Japanese candlesticks.
| S3 | S2 | S1 | Price | R1 | |
|---|---|---|---|---|---|
| ProTrendLines | 3,963.14 | 3,990.53 | 4,026.17 | 4,032.55 | 4,041.69 |
| Change (%) | -1.72% | -1.04% | -0.16% | - | +0.23% |
| Change | -69.41 | -42.02 | -6.38 | - | +9.14 |
| Level | Minor | Major | Minor | - | Intermediate |
Attention could also be paid to pivot points to set price objectives:
| Pivot points | S3 | S2 | S1 | PP | R1 | R2 | R3 |
|---|---|---|---|---|---|---|---|
| Standard | 3,976.23 | 3,989.53 | 4,012.22 | 4,025.52 | 4,048.21 | 4,061.51 | 4,084.20 |
| Camarilla | 4,025.02 | 4,028.32 | 4,031.62 | 4,034.92 | 4,038.22 | 4,041.52 | 4,044.82 |
| Woodie | 3,980.94 | 3,991.88 | 4,016.93 | 4,027.87 | 4,052.92 | 4,063.86 | 4,088.91 |
| Fibonacci | 3,989.53 | 4,003.28 | 4,011.77 | 4,025.52 | 4,039.27 | 4,047.76 | 4,061.51 |
| Pivot points | S3 | S2 | S1 | PP | R1 | R2 | R3 |
|---|---|---|---|---|---|---|---|
| Standard | 3,884.86 | 3,924.00 | 3,963.41 | 4,002.55 | 4,041.96 | 4,081.10 | 4,120.51 |
| Camarilla | 3,981.22 | 3,988.42 | 3,995.62 | 4,002.82 | 4,010.02 | 4,017.22 | 4,024.42 |
| Woodie | 3,885.00 | 3,924.07 | 3,963.55 | 4,002.62 | 4,042.10 | 4,081.17 | 4,120.65 |
| Fibonacci | 3,924.00 | 3,954.01 | 3,972.54 | 4,002.55 | 4,032.56 | 4,051.09 | 4,081.10 |
| Pivot points | S3 | S2 | S1 | PP | R1 | R2 | R3 |
|---|---|---|---|---|---|---|---|
| Standard | 3,711.97 | 3,763.82 | 3,839.36 | 3,891.21 | 3,966.75 | 4,018.60 | 4,094.14 |
| Camarilla | 3,879.88 | 3,891.56 | 3,903.23 | 3,914.91 | 3,926.59 | 3,938.27 | 3,949.94 |
| Woodie | 3,723.83 | 3,769.74 | 3,851.22 | 3,897.13 | 3,978.61 | 4,024.52 | 4,106.00 |
| Fibonacci | 3,763.82 | 3,812.48 | 3,842.54 | 3,891.21 | 3,939.87 | 3,969.93 | 4,018.60 |
Numerical data
The following is the status of the technical indicators and moving averages at the time of publication of this technical analysis:
| RSI (14): | 56.38 | |
| MACD (12,26,9): | 5.6300 | |
| Directional Movement: | 1.81 | |
| AROON (14): | 35.72 | |
| DEMA (21): | 4,030.59 | |
| Parabolic SAR (0,02-0,02-0,2): | 4,037.96 | |
| Elder Ray (13): | 1.67 | |
| Super Trend (3,10): | 4,010.38 | |
| Zig ZAG (10): | 4,027.79 | |
| VORTEX (21): | 1.1100 | |
| Stochastique (14,3,5): | 65.30 | |
| TEMA (21): | 4,033.83 | |
| Williams %R (14): | -37.02 | |
| Chande Momentum Oscillator (20): | 7.74 | |
| Repulse (5,40,3): | -0.0300 | |
| ROCnROLL: | 1 | |
| TRIX (15,9): | 0.0200 | |
| Courbe Coppock: | 0.78 |
| MA7: | 4,013.50 | |
| MA20: | 3,977.74 | |
| MA50: | 3,881.10 | |
| MA100: | 3,768.72 | |
| MAexp7: | 4,028.31 | |
| MAexp20: | 4,023.38 | |
| MAexp50: | 4,015.34 | |
| MAexp100: | 4,001.71 | |
| Price / MA7: | +0.47% | |
| Price / MA20: | +1.38% | |
| Price / MA50: | +3.90% | |
| Price / MA100: | +7.00% | |
| Price / MAexp7: | +0.11% | |
| Price / MAexp20: | +0.23% | |
| Price / MAexp50: | +0.43% | |
| Price / MAexp100: | +0.77% |
About author
Online


Add a comment
Comments
0 comments on the analysis FTSE EURO TOP 100 - 1H