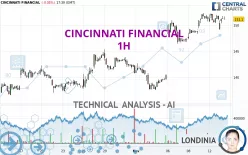
CINCINNATI FINANCIAL - 1H - Technical analysis published on 11/13/2024 (GMT)
- 117
- 0
Click here for a new analysis!
- Timeframe : 1H
- - Analysis generated on
- Status : TARGET REACHED

Summary of the analysis

Additional analysis
Quotes
CINCINNATI FINANCIAL rating 151.10 USD. On the day, this instrument lost -0.05% and was traded between 149.17 USD and 151.74 USD over the period. The price is currently at +1.29% from its lowest and -0.42% from its highest.The Central Gaps scanner detects a bearish gap which is a sign that the sellers have taken the lead in the very short term.
Opening Gap DOWN
Type : Bearish
Timeframe : Openning
So that you have an overall view of the price change, here is a table showing the variations over several periods:
New HIGH record (5 years)
Type : Bullish
Timeframe : Weekly
Near a new HIGH record (1 year)
Type : Bullish
Timeframe : Weekly
Near a new HIGH record (1st january)
Type : Bullish
Timeframe : Weekly
Near a new HIGH record (1 month)
Type : Bullish
Timeframe : Weekly
Technical
A technical analysis in 1H of this CINCINNATI FINANCIAL chart shows a strongly bullish trend. 92.86% of the signals given by moving averages are bullish. This strongly bullish trend is supported by the strong bullish signals given by short-term moving averages. There is no crossing of moving average by the price or crossing of moving averages between themselves.
The technical indicators are generally neutral. They do not provide relevant information on the direction of future price movements.
The Central Indicators scanner found this result concerning these indicators:
Price is back over the pivot point
Type : Bullish
Timeframe : 1 hour
The Central Patterns scanner, which studies chart patterns, resistances and supports, has identified this signal:
Near horizontal resistance
Type : Bearish
Timeframe : 1 hour
There is also a Japanese candlestick pattern detected by Central Candlesticks that could mark the end of the current short-term trend:
White hanging man / hammer
Type : Neutral
Timeframe : 1 hour
| S3 | S2 | S1 | Price | R1 | |
|---|---|---|---|---|---|
| ProTrendLines | 132.86 | 137.69 | 144.49 | 151.10 | 152.28 |
| Change (%) | -12.07% | -8.87% | -4.37% | - | +0.78% |
| Change | -18.24 | -13.41 | -6.61 | - | +1.18 |
| Level | Major | Major | Intermediate | - | Intermediate |
Attention could also be paid to pivot points to set price objectives:
| Pivot points | S3 | S2 | S1 | PP | R1 | R2 | R3 |
|---|---|---|---|---|---|---|---|
| Standard | 148.51 | 149.45 | 150.32 | 151.26 | 152.13 | 153.07 | 153.94 |
| Camarilla | 150.68 | 150.85 | 151.01 | 151.18 | 151.35 | 151.51 | 151.68 |
| Woodie | 148.47 | 149.43 | 150.28 | 151.24 | 152.09 | 153.05 | 153.90 |
| Fibonacci | 149.45 | 150.15 | 150.57 | 151.26 | 151.96 | 152.38 | 153.07 |
| Pivot points | S3 | S2 | S1 | PP | R1 | R2 | R3 |
|---|---|---|---|---|---|---|---|
| Standard | 127.26 | 132.46 | 140.57 | 145.77 | 153.88 | 159.08 | 167.19 |
| Camarilla | 145.03 | 146.25 | 147.47 | 148.69 | 149.91 | 151.13 | 152.35 |
| Woodie | 128.73 | 133.19 | 142.04 | 146.50 | 155.35 | 159.81 | 168.66 |
| Fibonacci | 132.46 | 137.54 | 140.68 | 145.77 | 150.85 | 153.99 | 159.08 |
| Pivot points | S3 | S2 | S1 | PP | R1 | R2 | R3 |
|---|---|---|---|---|---|---|---|
| Standard | 120.33 | 126.23 | 133.53 | 139.43 | 146.73 | 152.63 | 159.93 |
| Camarilla | 137.20 | 138.41 | 139.62 | 140.83 | 142.04 | 143.25 | 144.46 |
| Woodie | 121.03 | 126.58 | 134.23 | 139.78 | 147.43 | 152.98 | 160.63 |
| Fibonacci | 126.23 | 131.27 | 134.39 | 139.43 | 144.47 | 147.59 | 152.63 |
Numerical data
The following is the status of the technical indicators and moving averages at the time of publication of this technical analysis:
| RSI (14): | 58.40 | |
| MACD (12,26,9): | 0.9400 | |
| Directional Movement: | 5.90 | |
| AROON (14): | -78.57 | |
| DEMA (21): | 152.00 | |
| Parabolic SAR (0,02-0,02-0,2): | 152.12 | |
| Elder Ray (13): | 0.42 | |
| Super Trend (3,10): | 148.85 | |
| Zig ZAG (10): | 151.21 | |
| VORTEX (21): | 1.0700 | |
| Stochastique (14,3,5): | 65.07 | |
| TEMA (21): | 151.54 | |
| Williams %R (14): | -32.89 | |
| Chande Momentum Oscillator (20): | -0.45 | |
| Repulse (5,40,3): | 0.1400 | |
| ROCnROLL: | 1 | |
| TRIX (15,9): | 0.1200 | |
| Courbe Coppock: | 0.44 |
| MA7: | 148.49 | |
| MA20: | 143.45 | |
| MA50: | 138.83 | |
| MA100: | 132.01 | |
| MAexp7: | 151.12 | |
| MAexp20: | 150.57 | |
| MAexp50: | 148.18 | |
| MAexp100: | 145.44 | |
| Price / MA7: | +1.76% | |
| Price / MA20: | +5.33% | |
| Price / MA50: | +8.84% | |
| Price / MA100: | +14.46% | |
| Price / MAexp7: | -0.01% | |
| Price / MAexp20: | +0.35% | |
| Price / MAexp50: | +1.97% | |
| Price / MAexp100: | +3.89% |
News
Don't forget to follow the news on CINCINNATI FINANCIAL. At the time of publication of this analysis, the latest news was as follows:
- Cincinnati Financial Reports Third-Quarter 2024 Results
- Cincinnati Financial Schedules Webcast to Discuss Third-Quarter 2024 Results
- Cincinnati Financial Corporation Declares Regular Quarterly Cash Dividend
- Cincinnati Financial Reports Second-Quarter 2024 Results
- Cincinnati Financial Schedules Webcast to Discuss Second-Quarter 2024 Results
About author
Online


Add a comment
Comments
0 comments on the analysis CINCINNATI FINANCIAL - 1H