PRT NL INDEX - 1H - Technical analysis published on 10/30/2023 (GMT)
- 112
- 0
Click here for a new analysis!
- Timeframe : 1H
- - Analysis generated on
- Status : INVALID
Summary of the analysis

Additional analysis
Quotes
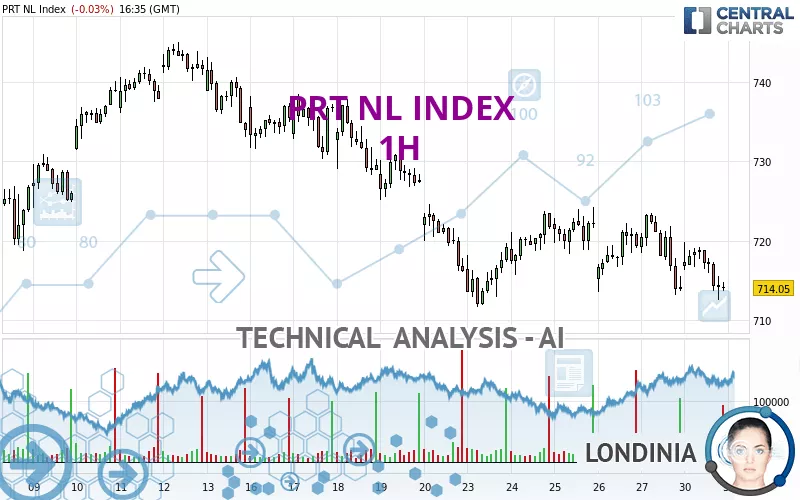
The PRT NL INDEX price is 714.05 EUR. On the day, this instrument lost -0.03% and was traded between 712.61 EUR and 719.80 EUR over the period. The price is currently at +0.20% from its lowest and -0.80% from its highest.The Central Gaps scanner detects a bullish opening marking the presence of buyers ahead of sellers at the opening but not sufficiently marked to allow the price to register a quotation gap.
Bullish opening
Type : Bullish
Timeframe : Openning
A study of price movements over other periods shows the following variations:
Near a new LOW record (1st january)
Type : Bearish
Timeframe : Weekly
Near a new HIGH record (1 month)
Type : Bullish
Timeframe : Weekly
Technical
Technical analysis of this 1H chart of PRT NL INDEX indicates that the overall trend is strongly bearish. 85.71% of the signals given by moving averages are bearish. This strongly bearish trend is supported by the strong bearish signals given by short-term moving averages. The Central Indicators market scanner currently does not detect any result that concerns moving averages.
An assessment of technical indicators shows a strong bearish signal.
But beware of excesses. The Central Indicators scanner currently detects this:
CCI indicator is oversold : under -100
Type : Neutral
Timeframe : 1 hour
CCI indicator: bullish divergence
Type : Bullish
Timeframe : 1 hour
Williams %R indicator is oversold : under -80
Type : Neutral
Timeframe : 1 hour
Price is back under the pivot point
Type : Bearish
Timeframe : Weekly
No signals are given by Central Patterns, a market scanner specialised in chart patterns, resistances and supports.
The Central Candlesticks scanner, specialised in Japanese candlesticks, did not identify any signals.
| S3 | S2 | S1 | Price | R1 | R2 | R3 | |
|---|---|---|---|---|---|---|---|
| ProTrendLines | 380.12 | 511.06 | 630.13 | 714.05 | 716.42 | 724.26 | 735.12 |
| Change (%) | -46.77% | -28.43% | -11.75% | - | +0.33% | +1.43% | +2.95% |
| Change | -333.93 | -202.99 | -83.92 | - | +2.37 | +10.21 | +21.07 |
| Level | Major | Intermediate | Major | - | Intermediate | Intermediate | Major |
Pivot points can also be used to set your price objectives. Here is the price situation in relation to pivot points:
| Pivot points | S3 | S2 | S1 | PP | R1 | R2 | R3 |
|---|---|---|---|---|---|---|---|
| Standard | 703.98 | 708.30 | 711.17 | 715.49 | 718.36 | 722.68 | 725.55 |
| Camarilla | 712.07 | 712.73 | 713.39 | 714.05 | 714.71 | 715.37 | 716.03 |
| Woodie | 703.27 | 707.94 | 710.46 | 715.13 | 717.65 | 722.32 | 724.84 |
| Fibonacci | 708.30 | 711.04 | 712.74 | 715.49 | 718.23 | 719.93 | 722.68 |
| Pivot points | S3 | S2 | S1 | PP | R1 | R2 | R3 |
|---|---|---|---|---|---|---|---|
| Standard | 696.64 | 704.16 | 709.21 | 716.73 | 721.78 | 729.30 | 734.35 |
| Camarilla | 710.79 | 711.95 | 713.10 | 714.25 | 715.40 | 716.56 | 717.71 |
| Woodie | 695.40 | 703.54 | 707.97 | 716.11 | 720.54 | 728.68 | 733.11 |
| Fibonacci | 704.16 | 708.97 | 711.93 | 716.73 | 721.54 | 724.50 | 729.30 |
| Pivot points | S3 | S2 | S1 | PP | R1 | R2 | R3 |
|---|---|---|---|---|---|---|---|
| Standard | 672.12 | 693.85 | 711.32 | 733.05 | 750.52 | 772.25 | 789.72 |
| Camarilla | 718.01 | 721.60 | 725.20 | 728.79 | 732.38 | 735.98 | 739.57 |
| Woodie | 669.99 | 692.79 | 709.19 | 731.99 | 748.39 | 771.19 | 787.59 |
| Fibonacci | 693.85 | 708.82 | 718.08 | 733.05 | 748.02 | 757.28 | 772.25 |
Numerical data
The following are the details of the technical indicators and moving averages that were collected to generate this technical analysis:
| RSI (14): | 38.97 | |
| MACD (12,26,9): | -1.3200 | |
| Directional Movement: | -13.49 | |
| AROON (14): | -92.86 | |
| DEMA (21): | 715.75 | |
| Parabolic SAR (0,02-0,02-0,2): | 721.41 | |
| Elder Ray (13): | -2.29 | |
| Super Trend (3,10): | 722.51 | |
| Zig ZAG (10): | 714.05 | |
| VORTEX (21): | 0.9100 | |
| Stochastique (14,3,5): | 13.94 | |
| TEMA (21): | 715.12 | |
| Williams %R (14): | -84.44 | |
| Chande Momentum Oscillator (20): | -6.46 | |
| Repulse (5,40,3): | -0.3100 | |
| ROCnROLL: | 2 | |
| TRIX (15,9): | -0.0200 | |
| Courbe Coppock: | 1.27 |
| MA7: | 718.14 | |
| MA20: | 726.17 | |
| MA50: | 732.54 | |
| MA100: | 750.27 | |
| MAexp7: | 715.63 | |
| MAexp20: | 717.31 | |
| MAexp50: | 719.47 | |
| MAexp100: | 722.53 | |
| Price / MA7: | -0.57% | |
| Price / MA20: | -1.67% | |
| Price / MA50: | -2.52% | |
| Price / MA100: | -4.83% | |
| Price / MAexp7: | -0.22% | |
| Price / MAexp20: | -0.45% | |
| Price / MAexp50: | -0.75% | |
| Price / MAexp100: | -1.17% |
About author
Online


Add a comment
Comments
0 comments on the analysis PRT NL INDEX - 1H