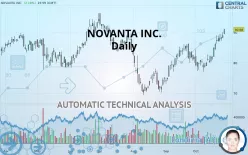
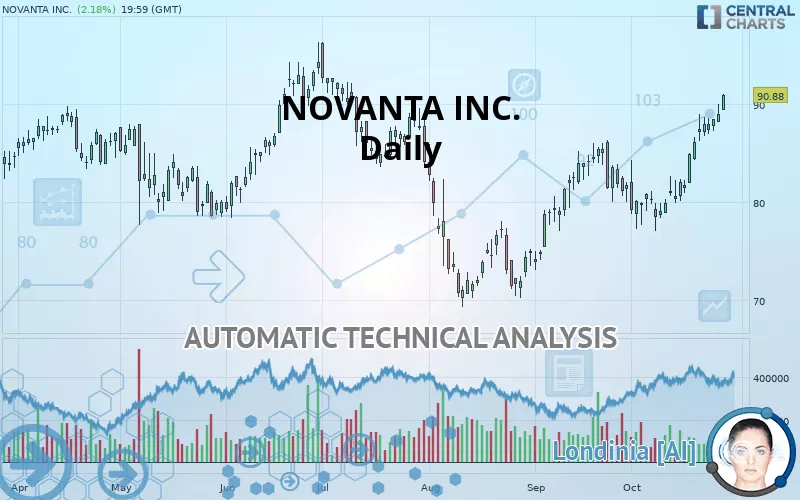
NOVANTA INC. - Daily - Technical analysis published on 10/29/2019 (GMT)
- 248
- 0
- Who voted?
Click here for a new analysis!
- Timeframe : Daily
- - Analysis generated on
- Status : INVALID
Summary of the analysis

Additional analysis
Quotes
The NOVANTA INC. price is 90.88 USD. The price registered an increase of +2.18% on the session with the lowest point at 89.40 USD and the highest point at 91.03 USD. The deviation from the price is +1.66% for the low point and -0.16% for the high point.The Central Gaps scanner detects a bullish opening marking the presence of buyers ahead of sellers at the opening but not sufficiently marked to allow the price to register a quotation gap.
Bullish opening
Type : Bullish
Timeframe : Openning
A study of price movements over other periods shows the following variations:
Technical
A technical analysis in Daily of this NOVANTA INC. chart shows a strongly bullish trend. 89.29% of the signals given by moving averages are bullish. The overall trend is supported by the strong bullish signals from short-term moving averages. The Central Indicators market scanner currently does not detect any result that concerns moving averages.
The probability of a further increase is high given the direction of the technical indicators.
Caution: the Central Indicators scanner currently detects an excess:
CCI indicator is overbought : over 100
Type : Neutral
Timeframe : Daily
MACD indicator: bearish divergence
Type : Bearish
Timeframe : Daily
Williams %R indicator is overbought : over -20
Type : Neutral
Timeframe : Daily
Pivot points : price is over resistance 1
Type : Neutral
Timeframe : Daily
Pivot points : price is over resistance 1
Type : Neutral
Timeframe : Weekly
An analysis of the price chart with the Central Patterns scanner (detector of chart patterns and resistances and supports) shows several results that can have an impact on the price change:
Near horizontal resistance
Type : Bearish
Timeframe : Daily
Resistance of channel is broken
Type : Bullish
Timeframe : Daily
No result was found by the Central Candlesticks scanner on Japanese candlesticks.
| S3 | S2 | S1 | Price | R1 | |
|---|---|---|---|---|---|
| ProTrendLines | 78.20 | 85.37 | 88.82 | 90.88 | 94.30 |
| Change (%) | -13.95% | -6.06% | -2.27% | - | +3.76% |
| Change | -12.68 | -5.51 | -2.06 | - | +3.42 |
| Level | Major | Intermediate | Major | - | Major |
Pivot points can also be used to set your price objectives. Here is the price situation in relation to pivot points:
| Pivot points | S3 | S2 | S1 | PP | R1 | R2 | R3 |
|---|---|---|---|---|---|---|---|
| Standard | 86.16 | 87.14 | 88.04 | 89.03 | 89.93 | 90.91 | 91.81 |
| Camarilla | 88.42 | 88.59 | 88.77 | 88.94 | 89.11 | 89.29 | 89.46 |
| Woodie | 86.11 | 87.12 | 88.00 | 89.01 | 89.88 | 90.89 | 91.77 |
| Fibonacci | 87.14 | 87.86 | 88.31 | 89.03 | 89.75 | 90.19 | 90.91 |
| Pivot points | S3 | S2 | S1 | PP | R1 | R2 | R3 |
|---|---|---|---|---|---|---|---|
| Standard | 82.94 | 84.57 | 86.76 | 88.39 | 90.57 | 92.20 | 94.39 |
| Camarilla | 87.89 | 88.24 | 88.59 | 88.94 | 89.29 | 89.64 | 89.99 |
| Woodie | 83.22 | 84.71 | 87.03 | 88.52 | 90.85 | 92.34 | 94.66 |
| Fibonacci | 84.57 | 86.03 | 86.93 | 88.39 | 89.84 | 90.74 | 92.20 |
| Pivot points | S3 | S2 | S1 | PP | R1 | R2 | R3 |
|---|---|---|---|---|---|---|---|
| Standard | 61.13 | 67.08 | 74.40 | 80.35 | 87.67 | 93.62 | 100.94 |
| Camarilla | 78.07 | 79.29 | 80.50 | 81.72 | 82.94 | 84.15 | 85.37 |
| Woodie | 61.82 | 67.42 | 75.09 | 80.69 | 88.36 | 93.96 | 101.63 |
| Fibonacci | 67.08 | 72.15 | 75.28 | 80.35 | 85.42 | 88.55 | 93.62 |
Numerical data
The following is the status of technical indicators and moving averages registered at the time this technical analysis was created:
| RSI (14): | 73.16 | |
| MACD (12,26,9): | 2.3600 | |
| Directional Movement: | 23.04 | |
| AROON (14): | 100.00 | |
| DEMA (21): | 87.50 | |
| Parabolic SAR (0,02-0,02-0,2): | 82.21 | |
| Elder Ray (13): | 4.11 | |
| Super Trend (3,10): | 83.66 | |
| Zig ZAG (10): | 90.88 | |
| VORTEX (21): | 1.1300 | |
| Stochastique (14,3,5): | 95.22 | |
| TEMA (21): | 89.10 | |
| Williams %R (14): | -1.19 | |
| Chande Momentum Oscillator (20): | 10.94 | |
| Repulse (5,40,3): | 3.3300 | |
| ROCnROLL: | 1 | |
| TRIX (15,9): | 0.2600 | |
| Courbe Coppock: | 19.96 |
| MA7: | 88.17 | |
| MA20: | 83.21 | |
| MA50: | 80.65 | |
| MA100: | 82.89 | |
| MAexp7: | 87.95 | |
| MAexp20: | 84.77 | |
| MAexp50: | 82.56 | |
| MAexp100: | 81.84 | |
| Price / MA7: | +3.07% | |
| Price / MA20: | +9.22% | |
| Price / MA50: | +12.68% | |
| Price / MA100: | +9.64% | |
| Price / MAexp7: | +3.33% | |
| Price / MAexp20: | +7.21% | |
| Price / MAexp50: | +10.08% | |
| Price / MAexp100: | +11.05% |
News
The last news published on NOVANTA INC. at the time of the generation of this analysis was as follows:
- Novanta Inc. Schedules Earnings Release and Conference Call for Tuesday, November 5, 2019
- Novanta to Participate at the BTIG Healthcare Conference on Thursday, February 28, 2019
- Novanta to Present at Baird's 2018 Global Industrial Conference on Wednesday, November 7, 2018
- Novanta Inc. Schedules Earnings Release and Conference Call for Tuesday, November 6, 2018
- Novanta Acquires Remaining Equity Interest in Laser Quantum
About author

Online


Add a comment
Comments
0 comments on the analysis NOVANTA INC. - Daily