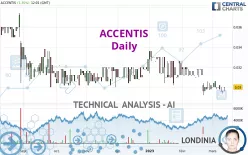
ACCENTIS - Daily - Technical analysis published on 03/13/2023 (GMT)
- 211
- 0
Click here for a new analysis!
- Timeframe : Daily
- - Analysis generated on
- Status : TARGET REACHED

Summary of the analysis
Additional analysis
Quotes
The ACCENTIS price is 0.0300 EUR. On the day, this instrument gained +1.35% and was between 0.0296 EUR and 0.0300 EUR. This implies that the price is at +1.35% from its lowest and at 0% from its highest.The Central Gaps scanner detects a bullish gap which is a sign that buyers have taken the lead in the very short term.
Opening Gap UP
Type : Bullish
Timeframe : Openning
So that you have an overall view of the price change, here is a table showing the variations over several periods:
Near a new LOW record (1 year)
Type : Bearish
Timeframe : Weekly
Near a new LOW record (1st january)
Type : Bearish
Timeframe : Weekly
Near a new LOW record (1 month)
Type : Bearish
Timeframe : Weekly
Technical
A technical analysis in Daily of this ACCENTIS chart shows a sharp bearish trend. The signals given by moving averages are 92.86% bearish. This strong bearish trend is confirmed by the strong signals currently being given by short-term moving averages. There is no crossing of moving average by the price or crossing of moving averages between themselves.
In fact, Central Analyzer took into account 18 technical indicators and the result was as follows: 7 are bullish, 6 are neutral and 5 are bearish. But beware of excesses. The Central Indicators scanner currently detects this:
MACD indicator: bullish divergence
Type : Bullish
Timeframe : Daily
Pivot points : price is over resistance 3
Type : Neutral
Timeframe : Daily
An analysis of the price chart with the Central Patterns scanner (detector of chart patterns and resistances and supports) shows a result that can have an impact on the price change:
Near support of channel
Type : Bullish
Timeframe : Daily
There is also a Japanese candlestick pattern detected by Central Candlesticks that could mark the end of the current short-term trend:
Doji
Type : Neutral
Timeframe : Daily
| S3 | S2 | S1 | Price | R1 | R2 | R3 | |
|---|---|---|---|---|---|---|---|
| ProTrendLines | 0.0186 | 0.0237 | 0.0266 | 0.0300 | 0.0304 | 0.0320 | 0.0346 |
| Change (%) | -38.00% | -21.00% | -11.33% | - | +1.33% | +6.67% | +15.33% |
| Change | -0.0114 | -0.0063 | -0.0034 | - | +0.0004 | +0.0020 | +0.0046 |
| Level | Minor | Major | Minor | - | Major | Intermediate | Minor |
To determine price objectives, it is also possible to use the pivot points. Here is the price position in relation to pivot points:
| Pivot points | S3 | S2 | S1 | PP | R1 | R2 | R3 |
|---|---|---|---|---|---|---|---|
| Standard | 0.0293 | 0.0293 | 0.0295 | 0.0295 | 0.0297 | 0.0297 | 0.0299 |
| Camarilla | 0.0296 | 0.0296 | 0.0296 | 0.0296 | 0.0296 | 0.0296 | 0.0297 |
| Woodie | 0.0293 | 0.0294 | 0.0295 | 0.0296 | 0.0297 | 0.0298 | 0.0299 |
| Fibonacci | 0.0293 | 0.0294 | 0.0295 | 0.0295 | 0.0296 | 0.0297 | 0.0297 |
| Pivot points | S3 | S2 | S1 | PP | R1 | R2 | R3 |
|---|---|---|---|---|---|---|---|
| Standard | 0.0285 | 0.0289 | 0.0293 | 0.0297 | 0.0301 | 0.0305 | 0.0309 |
| Camarilla | 0.0294 | 0.0295 | 0.0295 | 0.0296 | 0.0297 | 0.0298 | 0.0298 |
| Woodie | 0.0284 | 0.0289 | 0.0292 | 0.0297 | 0.0300 | 0.0305 | 0.0308 |
| Fibonacci | 0.0289 | 0.0292 | 0.0294 | 0.0297 | 0.0300 | 0.0302 | 0.0305 |
| Pivot points | S3 | S2 | S1 | PP | R1 | R2 | R3 |
|---|---|---|---|---|---|---|---|
| Standard | 0.0259 | 0.0275 | 0.0287 | 0.0303 | 0.0315 | 0.0331 | 0.0343 |
| Camarilla | 0.0290 | 0.0293 | 0.0295 | 0.0298 | 0.0301 | 0.0303 | 0.0306 |
| Woodie | 0.0256 | 0.0274 | 0.0284 | 0.0302 | 0.0312 | 0.0330 | 0.0340 |
| Fibonacci | 0.0275 | 0.0286 | 0.0293 | 0.0303 | 0.0314 | 0.0321 | 0.0331 |
Numerical data
The following are the details of the technical indicators and moving averages that were collected to generate this technical analysis:
| RSI (14): | 44.25 | |
| MACD (12,26,9): | -0.0004 | |
| Directional Movement: | 2.6531 | |
| AROON (14): | 21.4286 | |
| DEMA (21): | 0.0298 | |
| Parabolic SAR (0,02-0,02-0,2): | 0.0318 | |
| Elder Ray (13): | -0.0003 | |
| Super Trend (3,10): | 0.0310 | |
| Zig ZAG (10): | 0.0300 | |
| VORTEX (21): | 0.8431 | |
| Stochastique (14,3,5): | 31.32 | |
| TEMA (21): | 0.0296 | |
| Williams %R (14): | -50.00 | |
| Chande Momentum Oscillator (20): | 0.0000 | |
| Repulse (5,40,3): | 0.5738 | |
| ROCnROLL: | 2 | |
| TRIX (15,9): | -0.1805 | |
| Courbe Coppock: | 5.81 |
| MA7: | 0.0299 | |
| MA20: | 0.0303 | |
| MA50: | 0.0311 | |
| MA100: | 0.0312 | |
| MAexp7: | 0.0299 | |
| MAexp20: | 0.0303 | |
| MAexp50: | 0.0308 | |
| MAexp100: | 0.0314 | |
| Price / MA7: | +0.33% | |
| Price / MA20: | -0.99% | |
| Price / MA50: | -3.54% | |
| Price / MA100: | -3.85% | |
| Price / MAexp7: | +0.33% | |
| Price / MAexp20: | -0.99% | |
| Price / MAexp50: | -2.60% | |
| Price / MAexp100: | -4.46% |
News
Don't forget to follow the news on ACCENTIS. At the time of publication of this analysis, the latest news was as follows:
About author

Online


Add a comment
Comments
0 comments on the analysis ACCENTIS - Daily