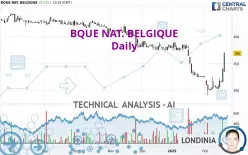
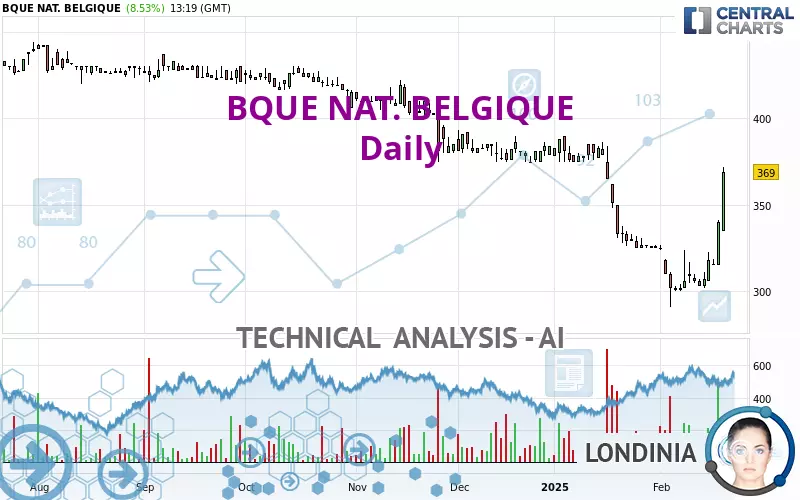
BQUE NAT. BELGIQUE - Daily - Technical analysis published on 02/20/2025 (GMT)
- 61
- 0
Click here for a new analysis!
- Timeframe : Daily
- - Analysis generated on
- Status : INVALID
Summary of the analysis

Additional analysis
Quotes
BQUE NAT. BELGIQUE rating 369.0 EUR. The price has increased by +8.53% since the last closing and was between 335.0 EUR and 372.0 EUR. This implies that the price is at +10.15% from its lowest and at -0.81% from its highest.A bearish opening was detected by the Central Gaps scanner. Sellers are trying to impose a bearish trend in the very short term.
Bearish opening
Type : Bearish
Timeframe : Openning
So that you have an overall view of the price change, here is a table showing the variations over several periods:
Near a new LOW record (5 years)
Type : Bearish
Timeframe : Weekly
New HIGH record (1 month)
Type : Bullish
Timeframe : Weekly
Technical
Technical analysis of BQUE NAT. BELGIQUE in Daily shows an overall slightly bearish trend. 57.14% of the signals given by moving averages are bearish. Caution: the strong bullish signals currently being given by short-term moving averages could quickly lead to a reversal of the trend. The Central Indicators market scanner is currently detecting several bullish signals that could impact this trend:
Bullish trend reversal : Moving Average 20
Type : Bullish
Timeframe : Daily
Bullish trend reversal : adaptative moving average 20
Type : Bullish
Timeframe : Daily
Bullish price crossover with Moving Average 50
Type : Bullish
Timeframe : Daily
In fact, 15 technical indicators on 18 studied are currently positioned bullish. But beware of excesses. The Central Indicators scanner currently detects this:
CCI indicator is overbought : over 100
Type : Neutral
Timeframe : Daily
Williams %R indicator is overbought : over -20
Type : Neutral
Timeframe : Daily
Pivot points : price is over resistance 2
Type : Neutral
Timeframe : Daily
Pivot points : price is over resistance 3
Type : Neutral
Timeframe : Weekly
The Central Patterns scanner, which studies chart patterns, resistances and supports, has identified these signals:
Near horizontal resistance
Type : Bearish
Timeframe : Daily
Resistance of channel is broken
Type : Bullish
Timeframe : Daily
The presence of these bullish Japanese candlestick patterns detected by Central Candlesticks that could cause a very short term rebound were also noted:
White line without lower shadow
Type : Bullish
Timeframe : Daily
Long white line
Type : Bullish
Timeframe : Daily
| S2 | S1 | Price | R1 | R2 | R3 | |
|---|---|---|---|---|---|---|
| ProTrendLines | 302.6 | 325.0 | 369.0 | 381.5 | 427.7 | 460.0 |
| Change (%) | -17.99% | -11.92% | - | +3.39% | +15.91% | +24.66% |
| Change | -66.4 | -44.0 | - | +12.5 | +58.7 | +91.0 |
| Level | Major | Minor | - | Minor | Intermediate | Minor |
Pivot points can also be used to set your price objectives. Here is the price situation in relation to pivot points:
| Pivot points | S3 | S2 | S1 | PP | R1 | R2 | R3 |
|---|---|---|---|---|---|---|---|
| Standard | 297.0 | 306.0 | 323.0 | 332.0 | 349.0 | 358.0 | 375.0 |
| Camarilla | 332.9 | 335.2 | 337.6 | 340.0 | 342.4 | 344.8 | 347.2 |
| Woodie | 301.0 | 308.0 | 327.0 | 334.0 | 353.0 | 360.0 | 379.0 |
| Fibonacci | 306.0 | 315.9 | 322.1 | 332.0 | 341.9 | 348.1 | 358.0 |
| Pivot points | S3 | S2 | S1 | PP | R1 | R2 | R3 |
|---|---|---|---|---|---|---|---|
| Standard | 276.0 | 289.0 | 298.0 | 311.0 | 320.0 | 333.0 | 342.0 |
| Camarilla | 301.0 | 303.0 | 305.0 | 307.0 | 309.0 | 311.0 | 313.1 |
| Woodie | 274.0 | 288.0 | 296.0 | 310.0 | 318.0 | 332.0 | 340.0 |
| Fibonacci | 289.0 | 297.4 | 302.6 | 311.0 | 319.4 | 324.6 | 333.0 |
| Pivot points | S3 | S2 | S1 | PP | R1 | R2 | R3 |
|---|---|---|---|---|---|---|---|
| Standard | 239.0 | 282.0 | 304.0 | 347.0 | 369.0 | 412.0 | 434.0 |
| Camarilla | 308.1 | 314.1 | 320.0 | 326.0 | 332.0 | 337.9 | 343.9 |
| Woodie | 228.5 | 276.8 | 293.5 | 341.8 | 358.5 | 406.8 | 423.5 |
| Fibonacci | 282.0 | 306.8 | 322.2 | 347.0 | 371.8 | 387.2 | 412.0 |
Numerical data
The following are the details of the technical indicators and moving averages that were collected to generate this technical analysis:
| RSI (14): | 69.90 | |
| MACD (12,26,9): | -5.2000 | |
| Directional Movement: | 30.6 | |
| AROON (14): | 78.6 | |
| DEMA (21): | 316.4 | |
| Parabolic SAR (0,02-0,02-0,2): | 297.2 | |
| Elder Ray (13): | 28.1 | |
| Super Trend (3,10): | 313.9 | |
| Zig ZAG (10): | 370.0 | |
| VORTEX (21): | 1.1000 | |
| Stochastique (14,3,5): | 88.30 | |
| TEMA (21): | 323.8 | |
| Williams %R (14): | -2.50 | |
| Chande Momentum Oscillator (20): | 60.0 | |
| Repulse (5,40,3): | 19.5000 | |
| ROCnROLL: | 1 | |
| TRIX (15,9): | -0.6000 | |
| Courbe Coppock: | 2.10 |
| MA7: | 322.9 | |
| MA20: | 318.8 | |
| MA50: | 352.0 | |
| MA100: | 380.9 | |
| MAexp7: | 331.4 | |
| MAexp20: | 327.1 | |
| MAexp50: | 347.0 | |
| MAexp100: | 371.5 | |
| Price / MA7: | +14.28% | |
| Price / MA20: | +15.75% | |
| Price / MA50: | +4.83% | |
| Price / MA100: | -3.12% | |
| Price / MAexp7: | +11.35% | |
| Price / MAexp20: | +12.81% | |
| Price / MAexp50: | +6.34% | |
| Price / MAexp100: | -0.67% |
About author
Online


Add a comment
Comments
0 comments on the analysis BQUE NAT. BELGIQUE - Daily