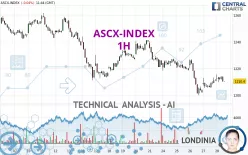
ASCX-INDEX - 1H - Technical analysis published on 06/28/2024 (GMT)
- 147
- 0
Click here for a new analysis!
- Timeframe : 1H
- - Analysis generated on
- Status : INVALID

Summary of the analysis

Additional analysis
Quotes
The ASCX-INDEX price is 1,210.73 EUR. The price is lower by -0.02% since the last closing and was traded between 1,209.84 EUR and 1,215.63 EUR over the period. The price is currently at +0.07% from its lowest and -0.40% from its highest.A bullish opening was detected by the Central Gaps scanner. Buyers are trying to impose a bullish momentum in the very short term.
Bullish opening
Type : Bullish
Timeframe : Openning
Here is a more detailed summary of the historical variations registered by ASCX-INDEX:
Near a new HIGH record (1st january)
Type : Bullish
Timeframe : Weekly
Near a new HIGH record (1 month)
Type : Bullish
Timeframe : Weekly
Technical
Technical analysis of ASCX-INDEX in 1H shows a overall strongly bearish trend. 82.14% of the signals given by moving averages are bearish. Caution: as the signals currently given by short-term moving averages are rather neutral, the global trend is slowing down. The Central Indicators scanner detects a bearish signal on moving averages that could impact this trend:
Bearish price crossover with adaptative moving average 20
Type : Bearish
Timeframe : 1 hour
In fact, only 9 technical indicators out of 18 studied are currently positioned bullish. Caution: the Central Indicators scanner currently detects an excess:
RSI indicator: bearish divergence
Type : Bearish
Timeframe : 1 hour
RSI indicator is back under 50
Type : Bearish
Timeframe : 1 hour
Central Patterns, the scanner specializing in chart patterns, did not identify any signals.
The Central Candlesticks scanner, specialised in Japanese candlesticks, did not identify any signals.
| S3 | S2 | S1 | Price | R1 | R2 | R3 | |
|---|---|---|---|---|---|---|---|
| ProTrendLines | 1,169.97 | 1,188.27 | 1,200.01 | 1,210.73 | 1,213.85 | 1,224.79 | 1,241.67 |
| Change (%) | -3.37% | -1.86% | -0.89% | - | +0.26% | +1.16% | +2.56% |
| Change | -40.76 | -22.46 | -10.72 | - | +3.12 | +14.06 | +30.94 |
| Level | Major | Minor | Intermediate | - | Major | Major | Intermediate |
Pivot points can also be used to set your price objectives. Here is the price situation in relation to pivot points:
| Pivot points | S3 | S2 | S1 | PP | R1 | R2 | R3 |
|---|---|---|---|---|---|---|---|
| Standard | 1,198.52 | 1,201.93 | 1,206.43 | 1,209.84 | 1,214.34 | 1,217.75 | 1,222.25 |
| Camarilla | 1,208.76 | 1,209.48 | 1,210.21 | 1,210.93 | 1,211.66 | 1,212.38 | 1,213.11 |
| Woodie | 1,199.07 | 1,202.20 | 1,206.98 | 1,210.11 | 1,214.89 | 1,218.02 | 1,222.80 |
| Fibonacci | 1,201.93 | 1,204.95 | 1,206.82 | 1,209.84 | 1,212.86 | 1,214.73 | 1,217.75 |
| Pivot points | S3 | S2 | S1 | PP | R1 | R2 | R3 |
|---|---|---|---|---|---|---|---|
| Standard | 1,181.22 | 1,196.97 | 1,209.88 | 1,225.63 | 1,238.54 | 1,254.29 | 1,267.20 |
| Camarilla | 1,214.91 | 1,217.54 | 1,220.16 | 1,222.79 | 1,225.42 | 1,228.04 | 1,230.67 |
| Woodie | 1,179.80 | 1,196.26 | 1,208.46 | 1,224.92 | 1,237.12 | 1,253.58 | 1,265.78 |
| Fibonacci | 1,196.97 | 1,207.92 | 1,214.68 | 1,225.63 | 1,236.58 | 1,243.34 | 1,254.29 |
| Pivot points | S3 | S2 | S1 | PP | R1 | R2 | R3 |
|---|---|---|---|---|---|---|---|
| Standard | 1,056.17 | 1,104.69 | 1,175.14 | 1,223.66 | 1,294.11 | 1,342.63 | 1,413.08 |
| Camarilla | 1,212.87 | 1,223.78 | 1,234.68 | 1,245.59 | 1,256.50 | 1,267.40 | 1,278.31 |
| Woodie | 1,067.14 | 1,110.17 | 1,186.11 | 1,229.14 | 1,305.08 | 1,348.11 | 1,424.05 |
| Fibonacci | 1,104.69 | 1,150.14 | 1,178.21 | 1,223.66 | 1,269.11 | 1,297.18 | 1,342.63 |
Numerical data
The following is the status of technical indicators and moving averages registered at the time this technical analysis was created:
| RSI (14): | 48.70 | |
| MACD (12,26,9): | -1.4300 | |
| Directional Movement: | 4.94 | |
| AROON (14): | 71.43 | |
| DEMA (21): | 1,209.15 | |
| Parabolic SAR (0,02-0,02-0,2): | 1,204.40 | |
| Elder Ray (13): | 1.62 | |
| Super Trend (3,10): | 1,215.68 | |
| Zig ZAG (10): | 1,212.27 | |
| VORTEX (21): | 0.8000 | |
| Stochastique (14,3,5): | 75.44 | |
| TEMA (21): | 1,210.80 | |
| Williams %R (14): | -36.54 | |
| Chande Momentum Oscillator (20): | 5.06 | |
| Repulse (5,40,3): | -0.0700 | |
| ROCnROLL: | -1 | |
| TRIX (15,9): | -0.0400 | |
| Courbe Coppock: | 0.83 |
| MA7: | 1,218.60 | |
| MA20: | 1,232.86 | |
| MA50: | 1,219.83 | |
| MA100: | 1,215.60 | |
| MAexp7: | 1,211.78 | |
| MAexp20: | 1,211.83 | |
| MAexp50: | 1,216.83 | |
| MAexp100: | 1,223.31 | |
| Price / MA7: | -0.65% | |
| Price / MA20: | -1.80% | |
| Price / MA50: | -0.75% | |
| Price / MA100: | -0.40% | |
| Price / MAexp7: | -0.09% | |
| Price / MAexp20: | -0.09% | |
| Price / MAexp50: | -0.50% | |
| Price / MAexp100: | -1.03% |
About author
Online


Add a comment
Comments
0 comments on the analysis ASCX-INDEX - 1H